The Diagnostics page holds SharKNX's tools for working with KNX devices on the bus: finding devices in programming mode, checking and managing a single device, scanning a whole line, and reading a device's communication tables from its memory. You open it with the Tools tab, the last tab in the bottom navigation bar.
It has four tabs: Prog. Mode, Devices, Line Scan, and Inspect. All of them need a gateway connection.
Device tools are a premium feature on Android, iOS, and macOS - see Subscription Plans.
Prog. Mode tab
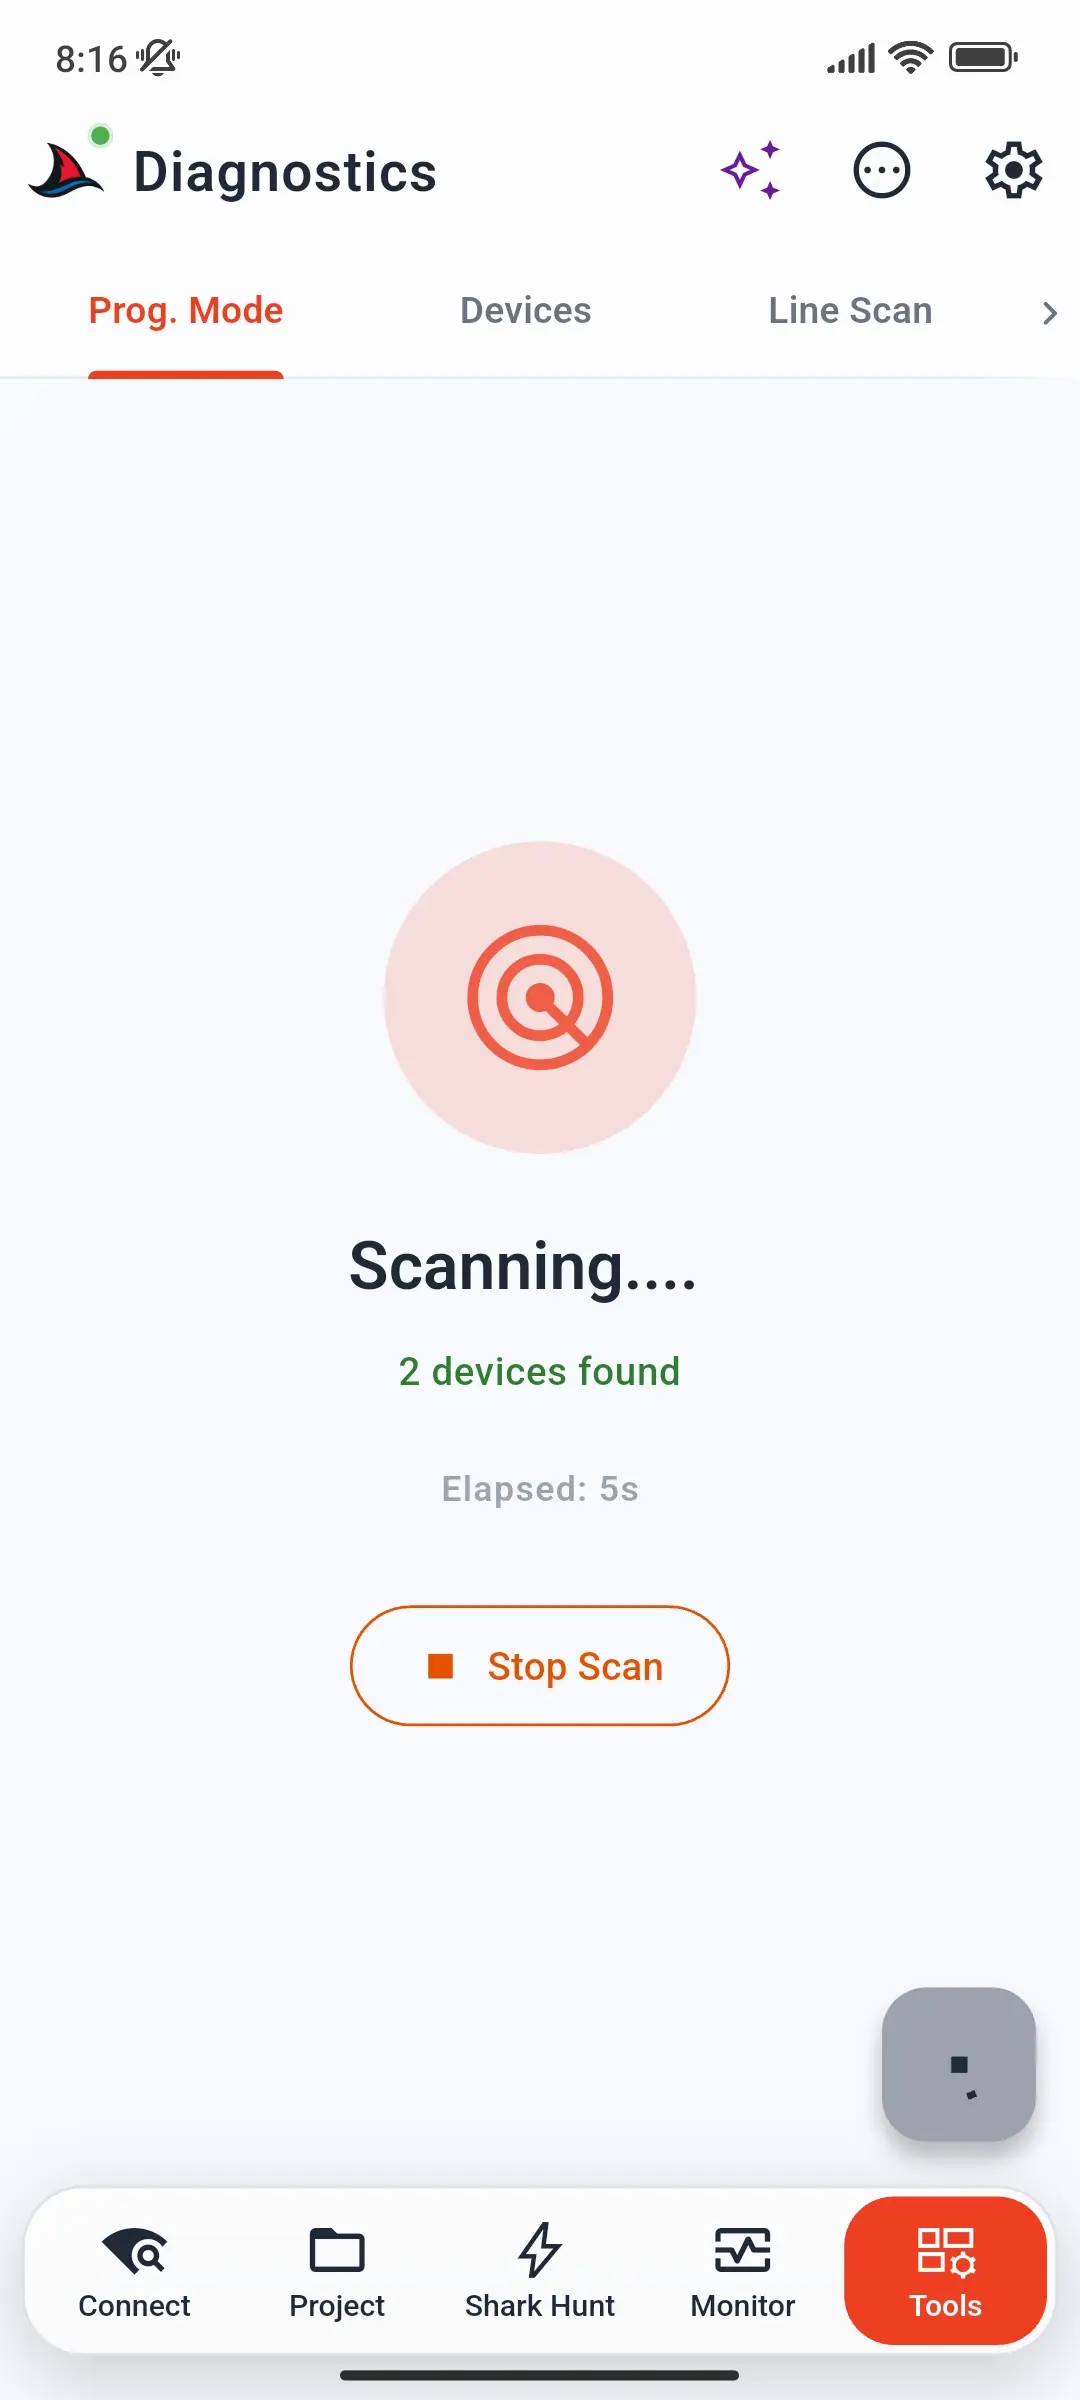
Finds every device whose programming button is pressed - the quickest way to identify the device in front of you.
- Press the programming button on the device.
- Tap the scan button. SharKNX shows Scanning..., how many devices it has found, and the elapsed time. Tap Stop Scan to end early.
- Each device found appears as a card with two buttons:
- Check Info - opens the device on the Devices tab
- Comm. Info - reads its communication tables on the Inspect tab
How long the scan runs and how often it asks is set in Scan Settings - by default 10 seconds, asking every 3 seconds.
Devices tab
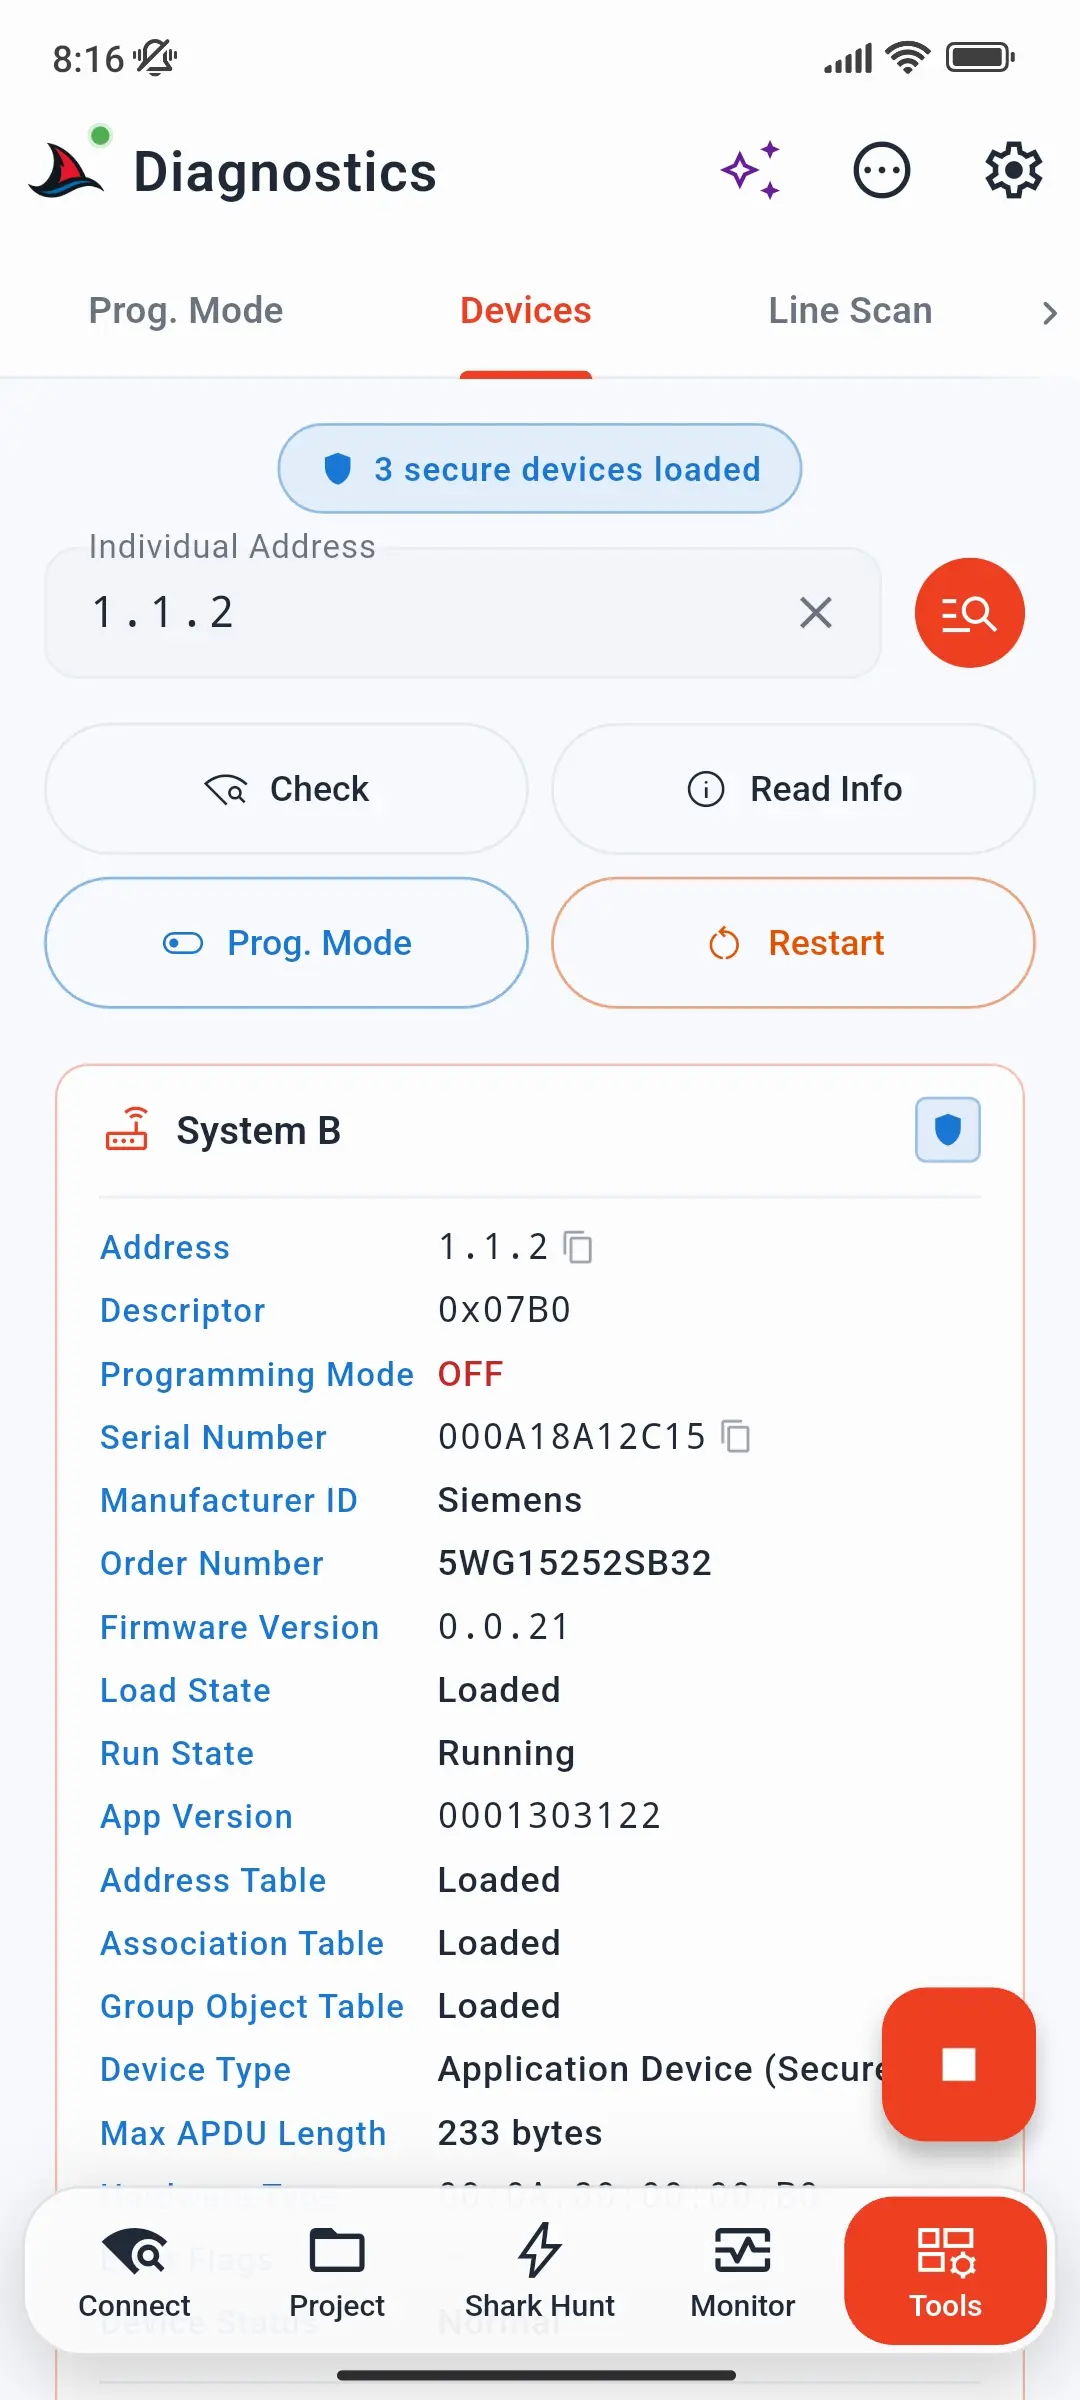
Checks and manages one device by its individual address.
- Enter the Individual Address, or tap the search button to pick a device from your ETS project.
- Use the actions:
| Action | Does |
|---|---|
| Check | Confirms whether the device answers on the bus |
| Read Info | Reads the device's details - see below |
| Prog. Mode | Switches the device's programming mode on or off remotely |
| Restart | Restarts the device, after asking you to confirm |
Read Info shows the device's descriptor (e.g. System B), programming mode, serial number, manufacturer, order number, firmware and application versions, load and run state, the state of its address, association, and group object tables, device type, maximum APDU length, hardware type, error flags, and device control. The serial number and address can be copied with one tap.
At the top, a chip shows the KNX Data Secure keys SharKNX has, for example 3 secure devices loaded - or No secure devices. Secured devices can only be managed with their tool key; see KNX Data Secure.
Line Scan tab
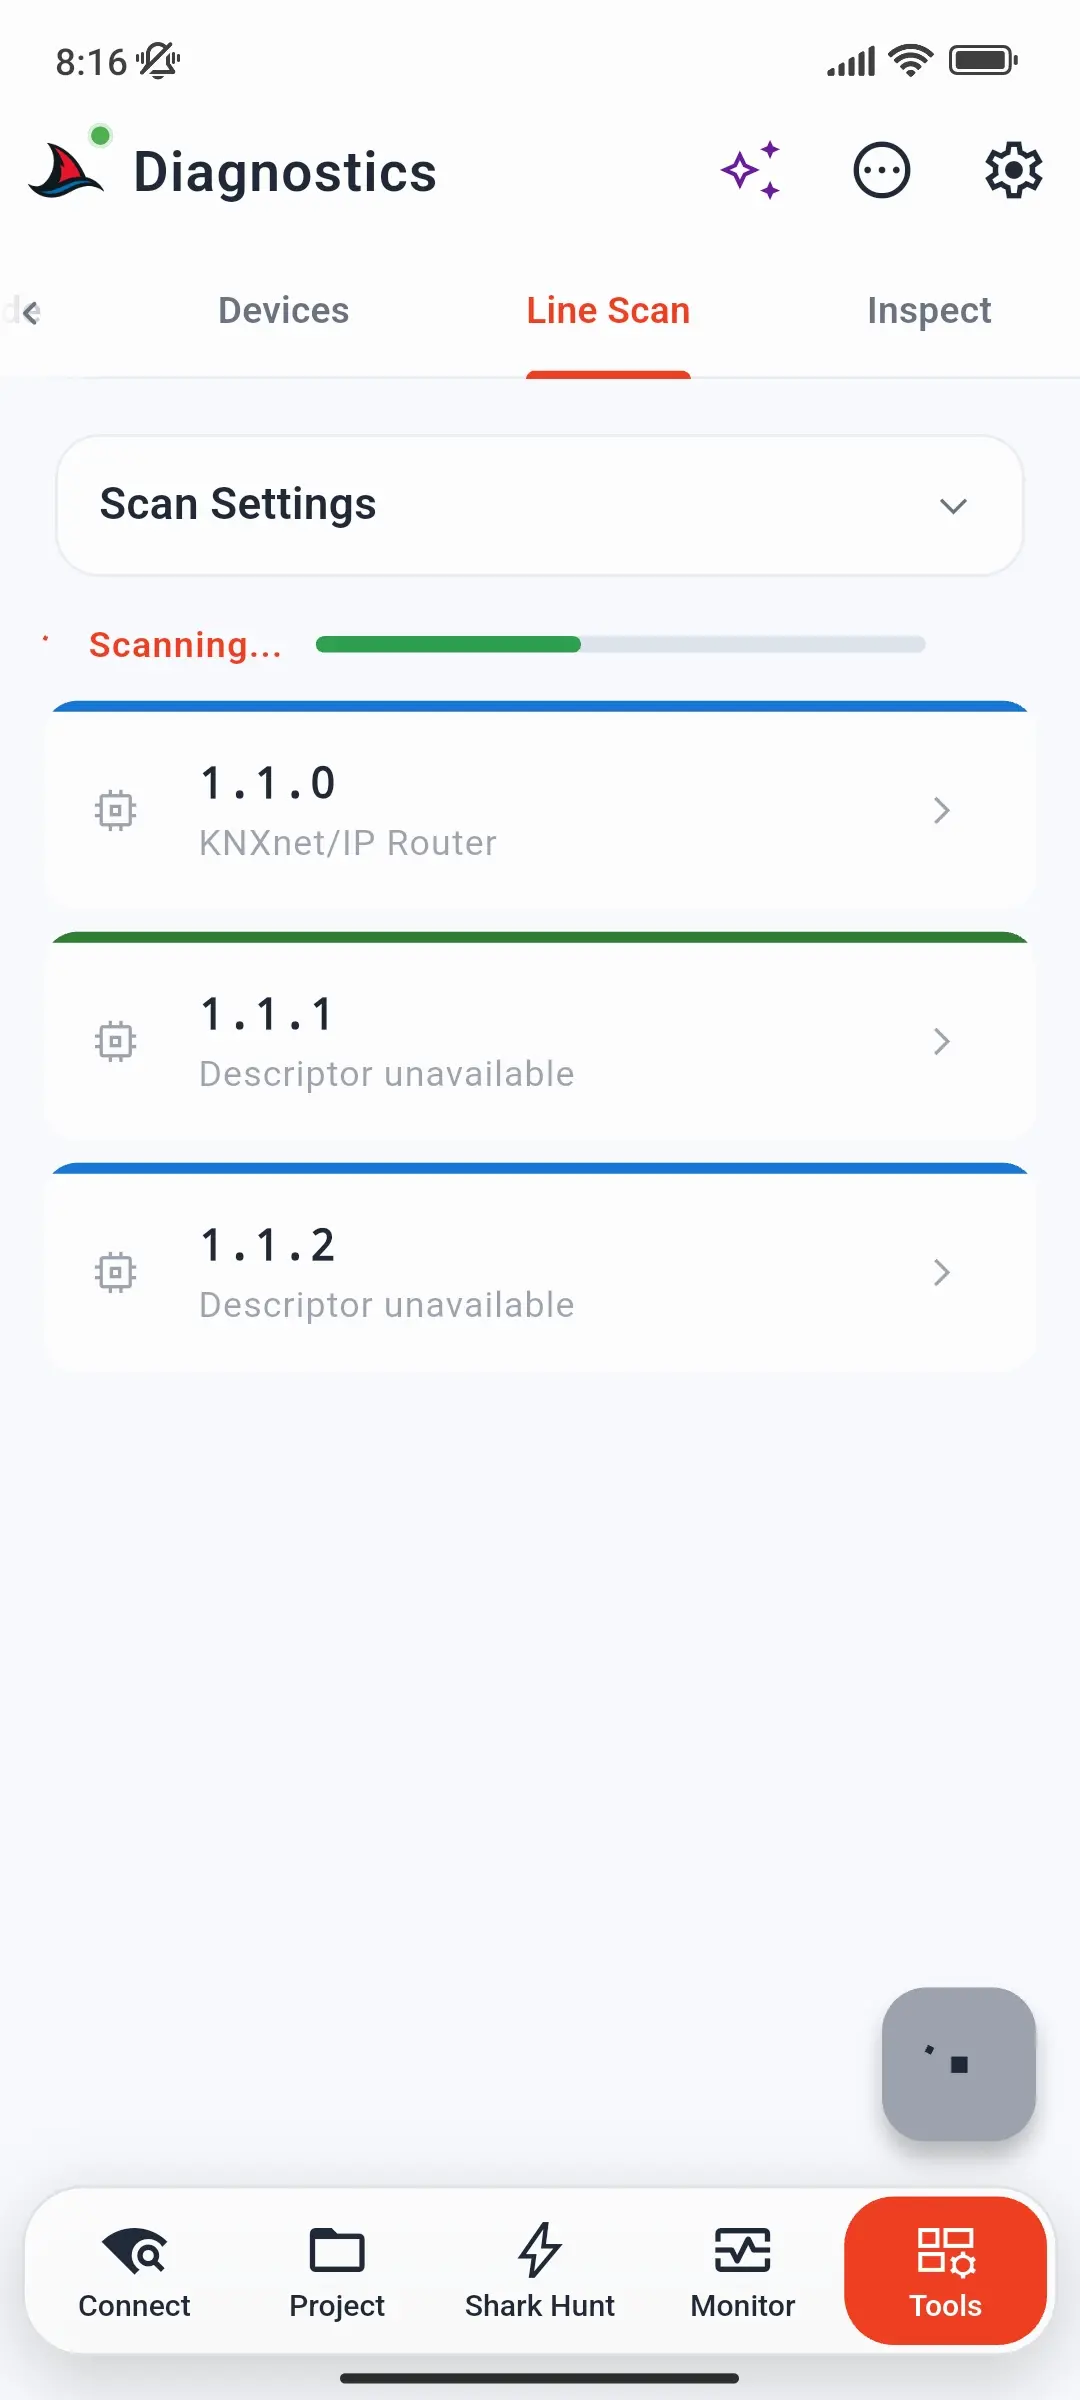
Scans a whole line for every device that answers - independent of any ETS project.
- Open Scan Settings and set the area and line (or Choose from project), the Medium, and the Scanning Range.
- Tap the scan button. Devices appear as cards while the progress bar runs.
- Tap Read Device Info after the scan to fill in the details of every device.
The coloured bar on each card shows the device type: green for KNX Data Secure devices, blue for IP devices and couplers, red for all others. Tap a card for its actions - Check, Read Info, Prog. Mode, Restart, Program Address, and Rebuild Communication.
PL and RF domains can be scanned by picking the line from your ETS project. Everything about line scans - mediums, domain scans, and exporting results - is in Scan a Bus Line.
Inspect tab
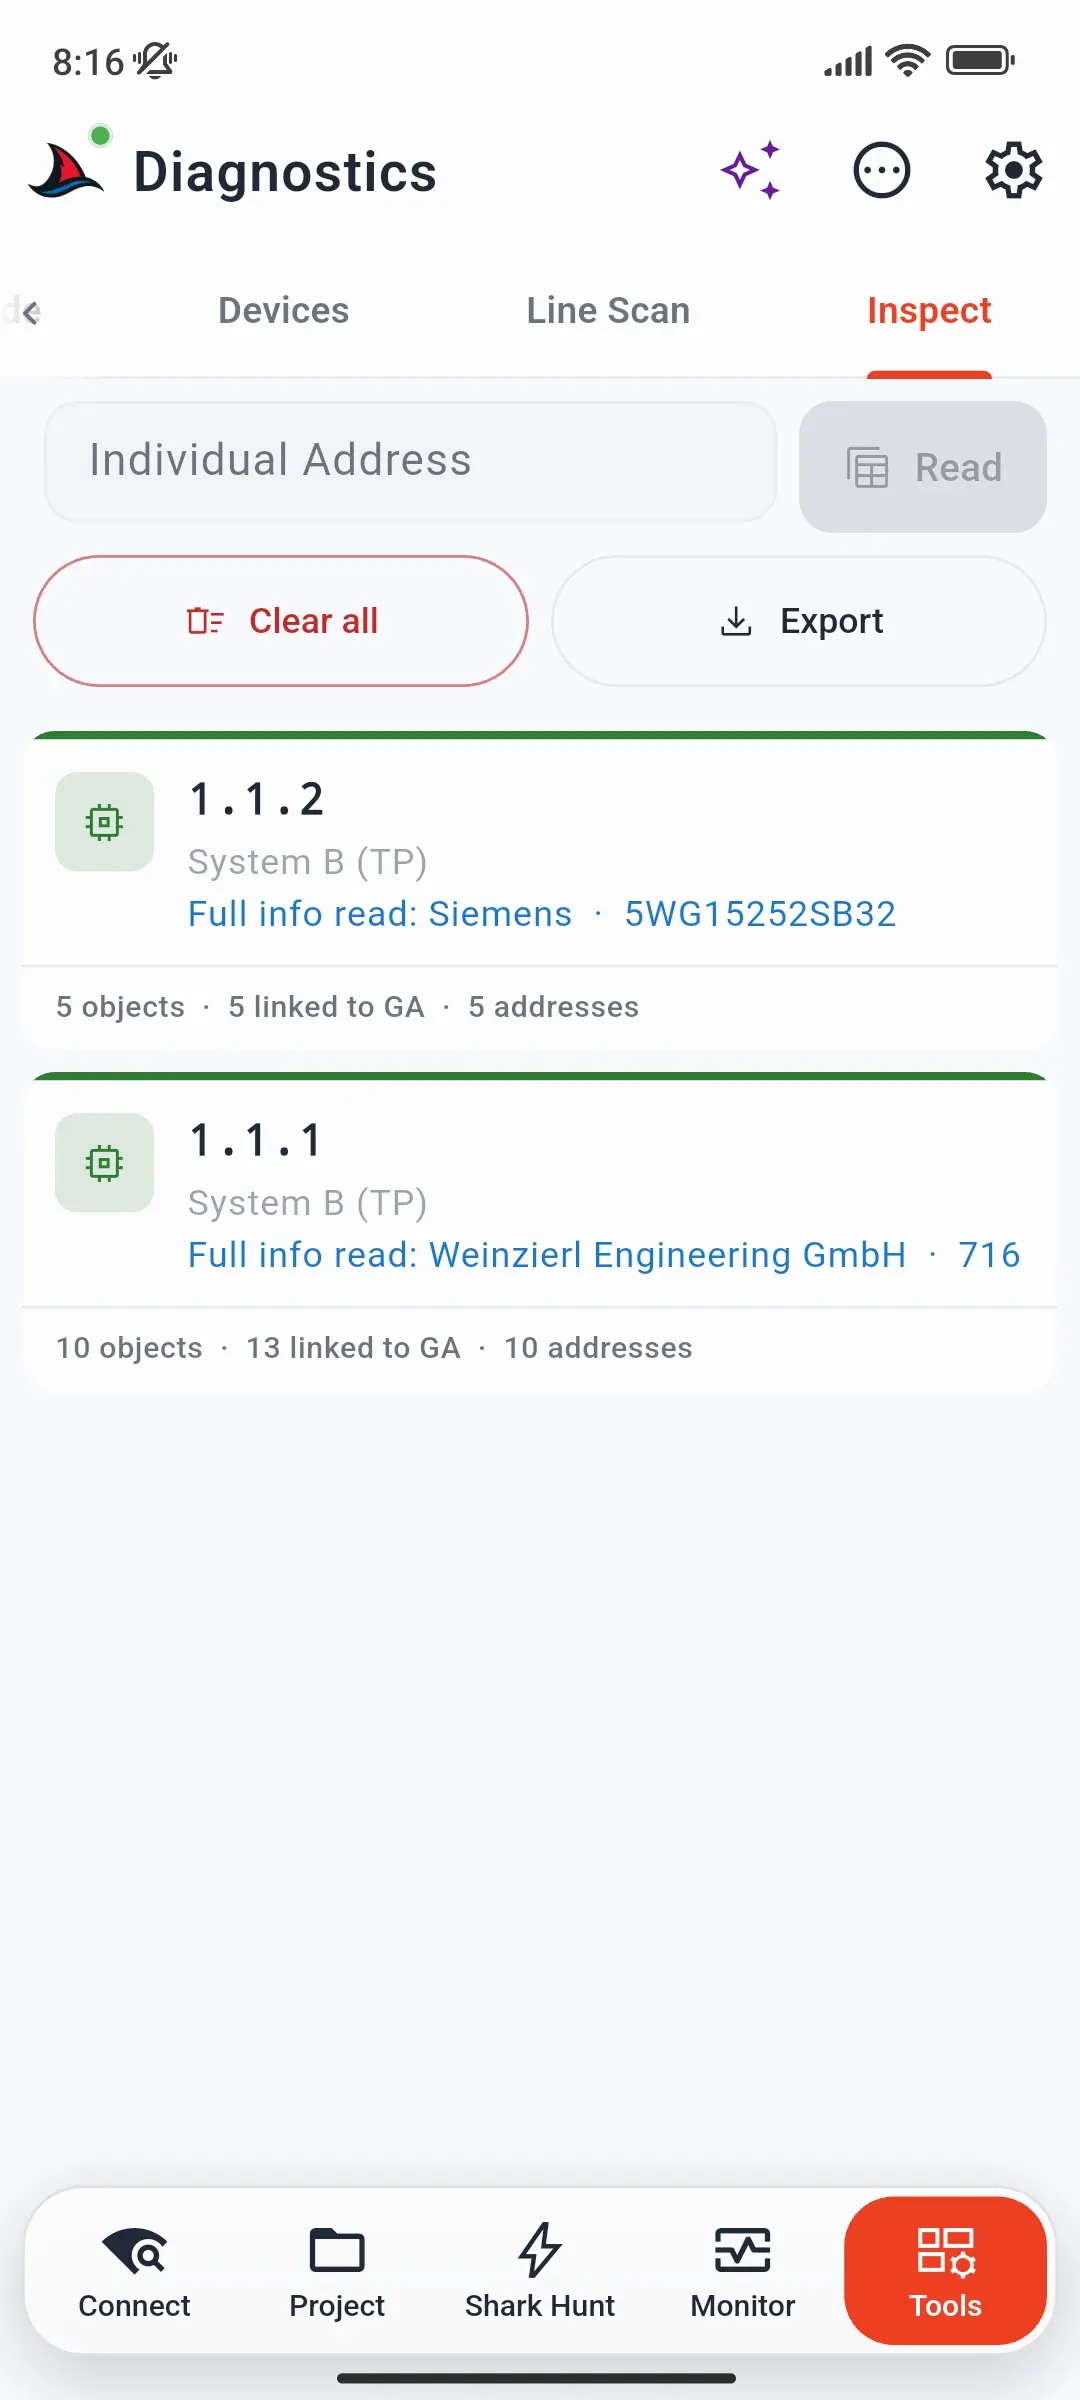
Reads a device's communication tables from its memory - which communication objects it has, their flags, and their group addresses - without an ETS project.
- Enter the Individual Address and tap Read.
- A card appears for the device, with its descriptor and how many objects, links, and group addresses it has. Read Full Info adds manufacturer and model.
Clear all removes every card; Export saves one PDF per device. Cards are kept across app restarts.
Device details
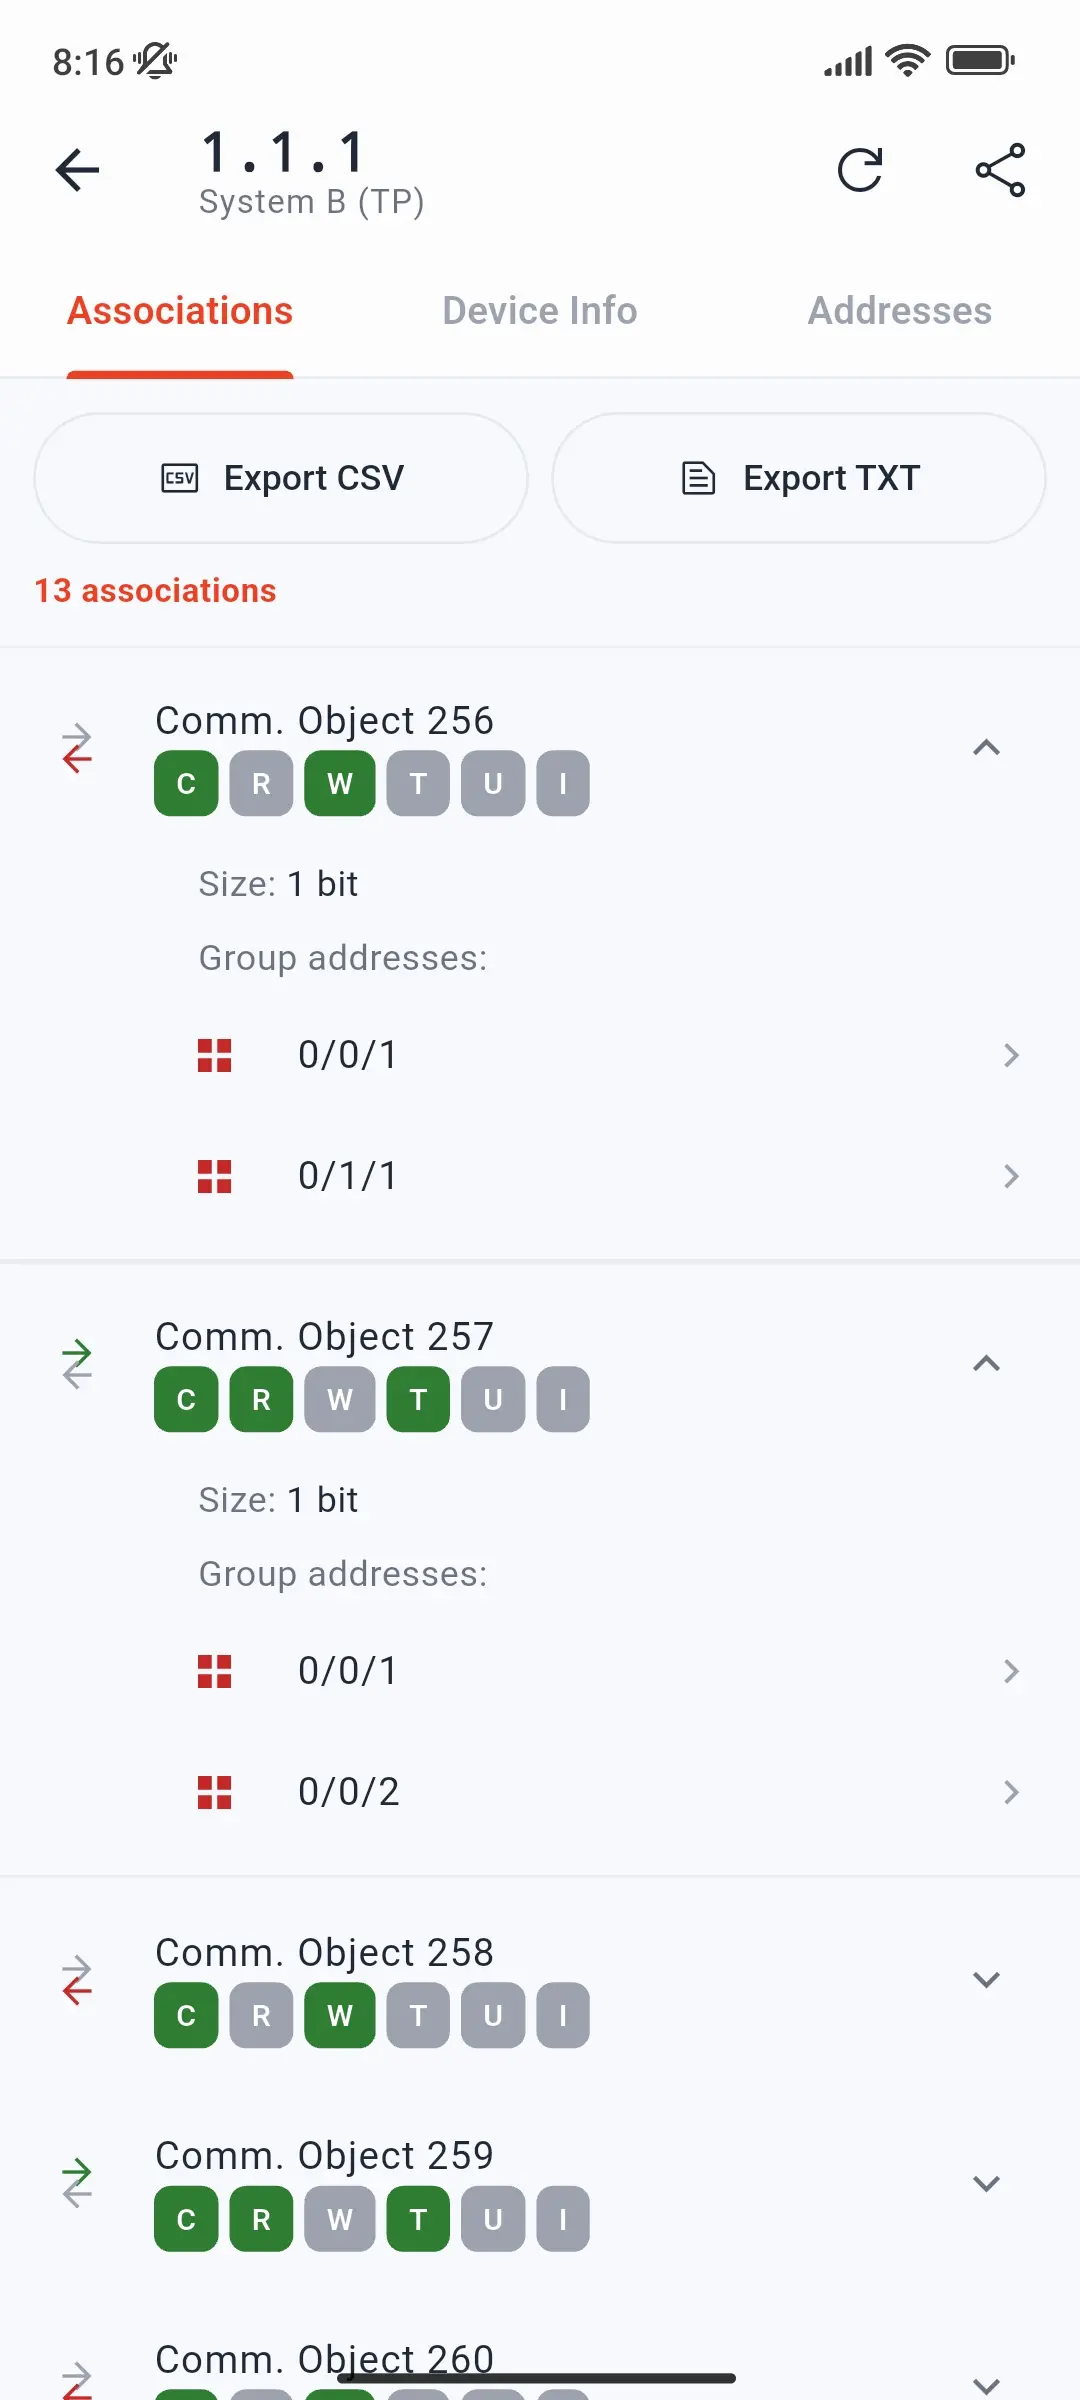
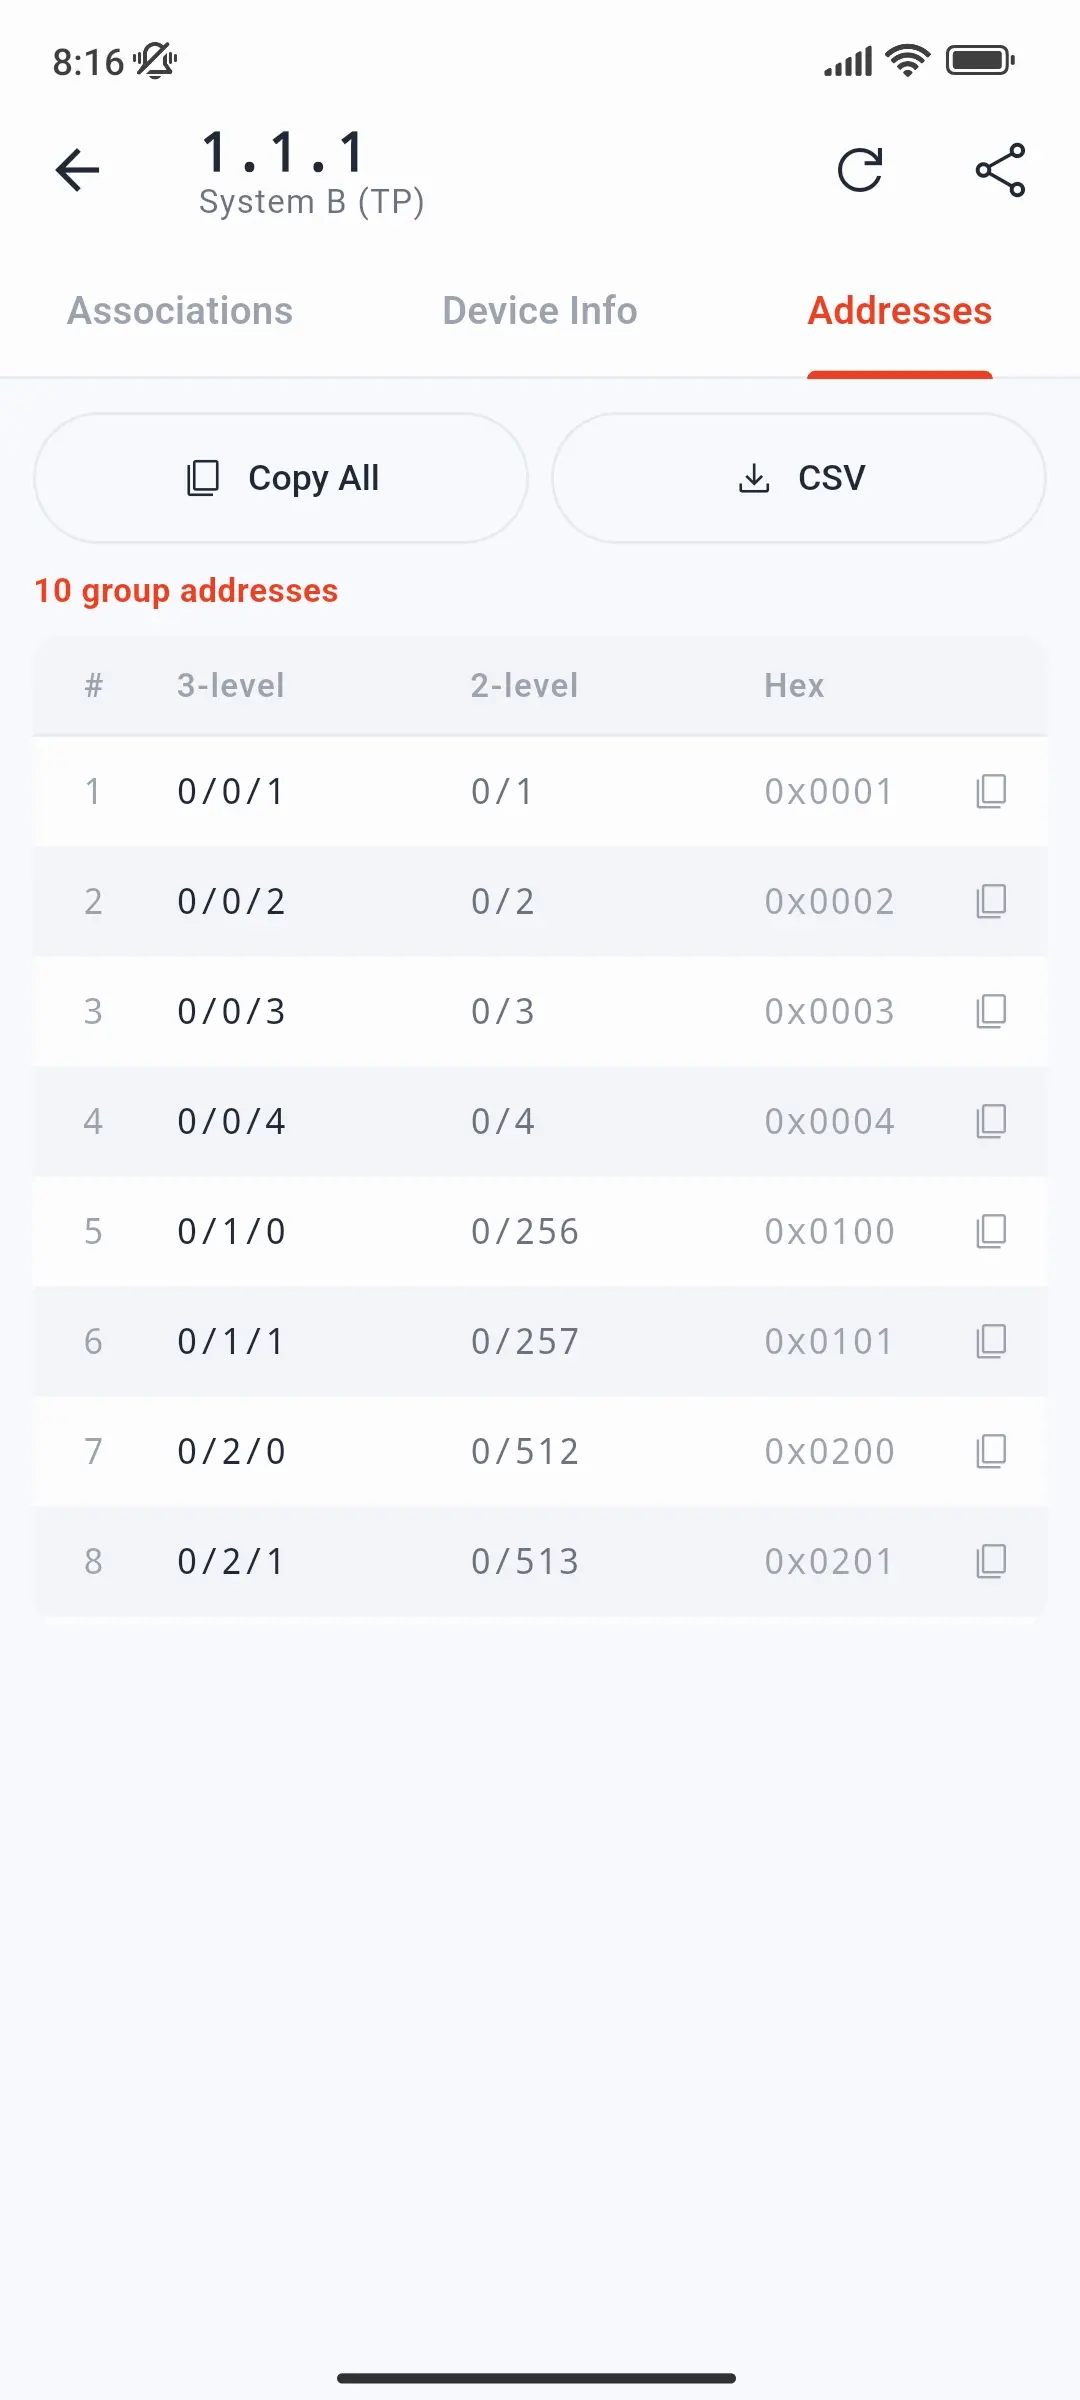
Tap a card to open the device's details, with reload and share (PDF) in the top bar and three tabs:
| Tab | Shows |
|---|---|
| Associations | Every communication object linked to group addresses, with its flags (C R W T U I), size, and group addresses. Tap a group address to read or write it. Export CSV and Export TXT save the list. |
| Device Info | The device's details, with Copy All |
| Addresses | The device's group address table - index, 3-level, 2-level, and hex - with Copy All and CSV |
For what the flags mean and how to test a device from here - including on installations without an ETS project - see Inspect a Device.
Actions for this page
On this page the ⋯ Actions sheet opens with Line Scan expanded: Export as Text and Export as PDF for the latest line scan. See Side Menu and Actions.
Related
- Program a Device Address - from the project, a line scan, or by serial number
- Scan a Bus Line - line and domain scans
- Inspect a Device - reading and testing devices
- Export Formats - line scan and device table reports