The Monitor page is SharKNX's live KNX bus monitor. It shows every telegram on the bus as it arrives - named and decoded when an ETS project is loaded - and lets you filter, inspect, plot, and export them, and send commands without leaving the page. It is the fourth tab in the bottom navigation bar.
Starting and stopping
Tap the green start button to begin.
- If you are not connected yet, SharKNX shows a picker with your saved gateways, discovered gateways, and multicast options.
- The session runs in Group Monitor mode - group traffic, with sending - or Bus Monitor mode, which captures every frame on the line, including acknowledgements, but is receive-only. The Start/Stop badge shows the mode; while the monitor is stopped, tap it to pick a mode and start straight away.
- While the monitor runs, the start button becomes the red send button - see Sending commands.
Tap Stop to end the session. The telegrams stay in the list until you clear them.
On mobile, the monitor stops when the screen locks or the app goes to the background. Keep Screen On in Monitor Settings is enabled by default to prevent it.
Filter bar
The filter field at the top narrows the list to what you are looking for. Type and tap the arrow to apply:
| Filter | Shows |
|---|---|
kitchen |
Every row containing kitchen |
1/2/* |
Telegrams to any group address under 1/2 |
1.1.5 |
Telegrams sent by device 1.1.5 |
apci:GroupValueWrite |
Write telegrams only |
value>=20 |
Decoded values of 20 or more |
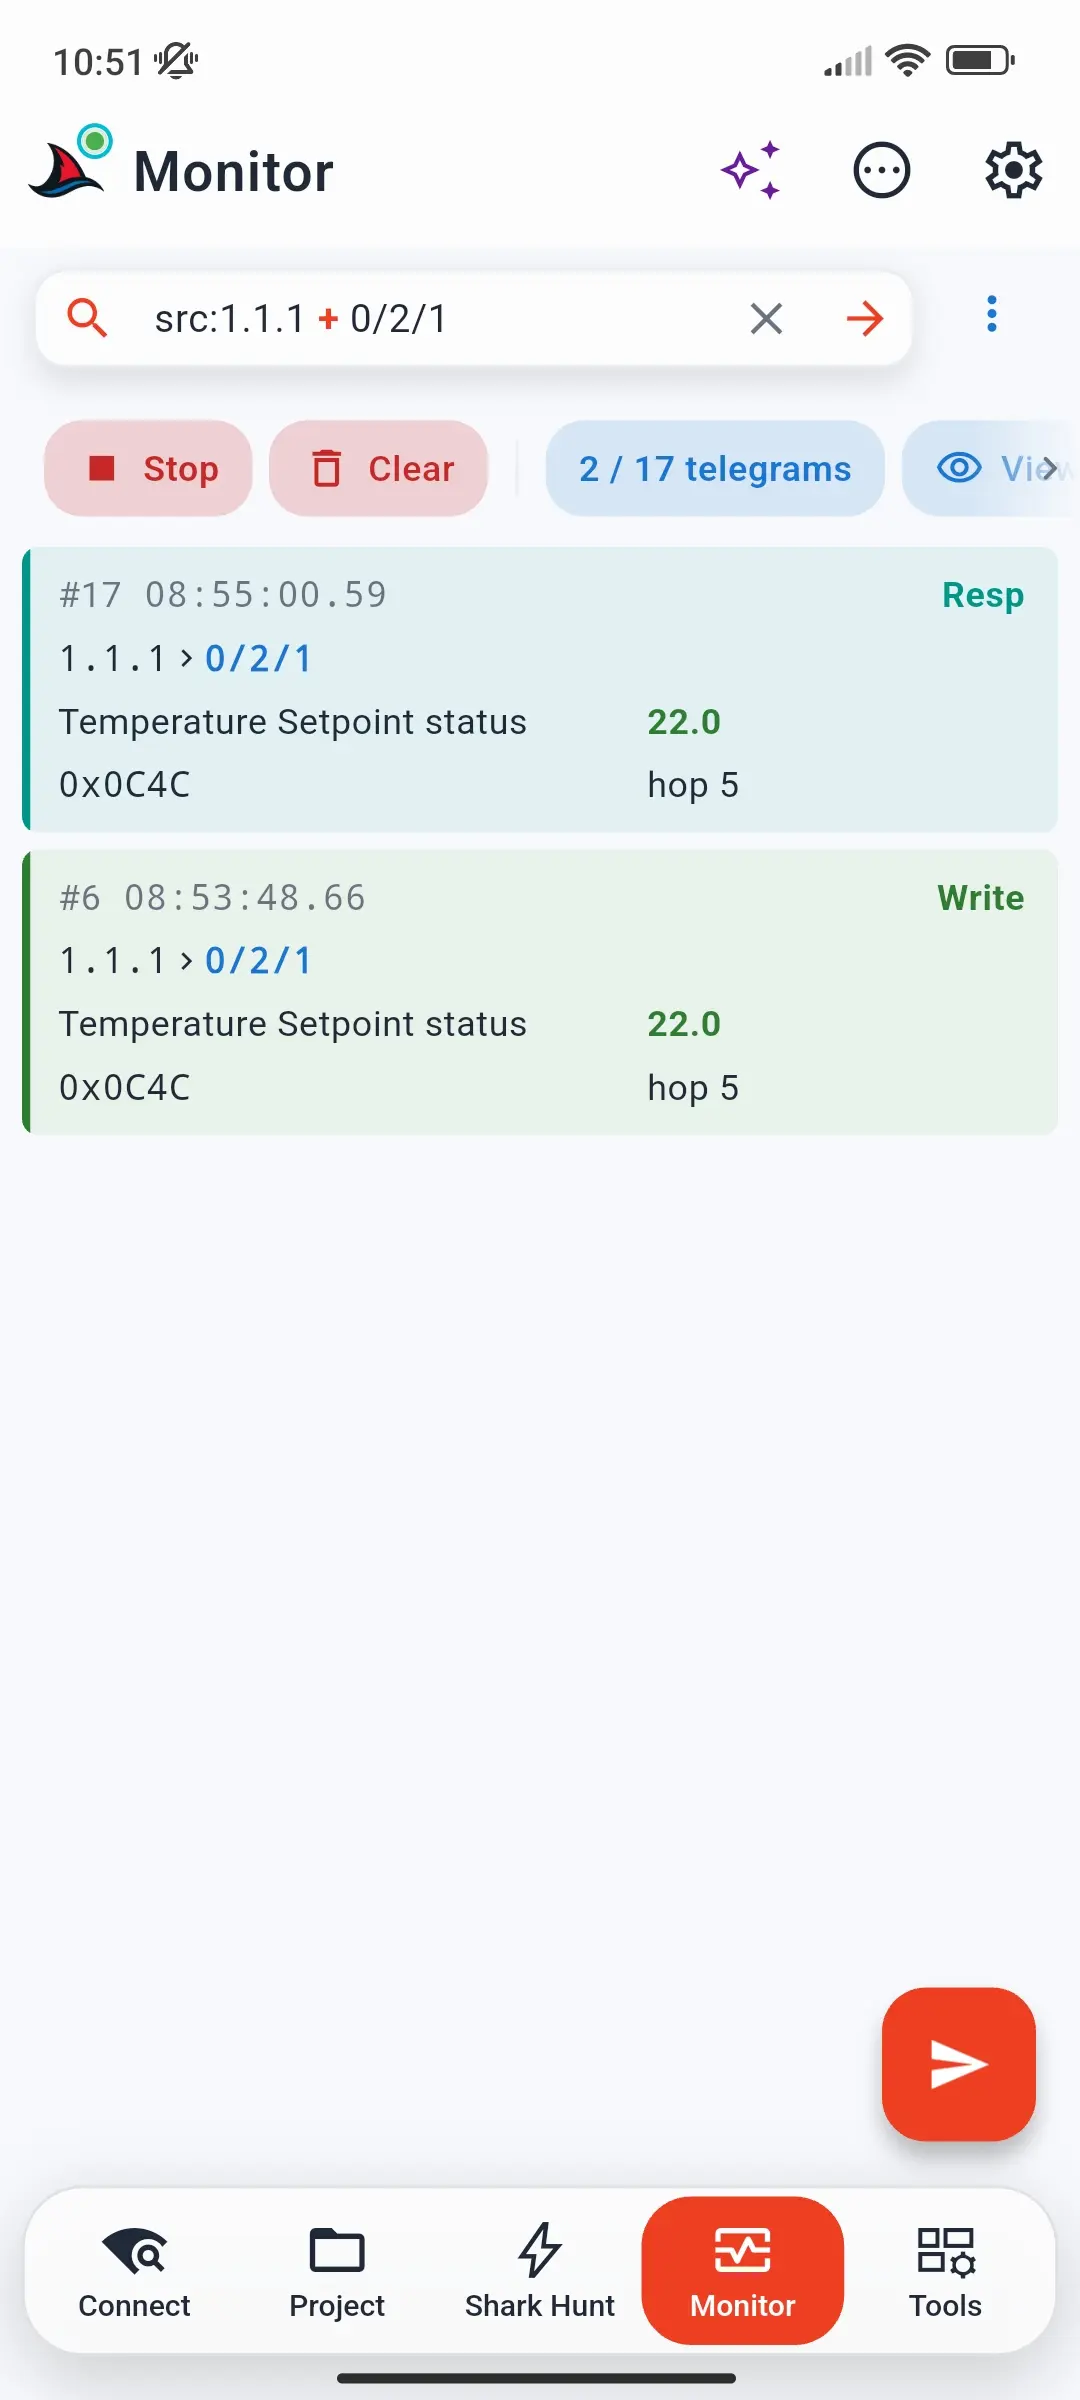
src:1.1.1 + 0/2/1 |
Telegrams from 1.1.1 to 0/2/1 |
Combine conditions with + (AND), | (OR), ! (NOT), and parentheses. If a filter can't be understood, the error is shown below the field and the last valid filter stays active. Filtering never deletes telegrams - the count badge shows how many match, for example 2 / 17 telegrams, and clearing the filter brings everything back. Every field and operator is in Monitor Filter Syntax.
On a phone, three more tools sit in the ⋮ menu next to the field (on larger screens they are buttons):
- Filter by Group Address - pick a group address or device from your ETS project to filter by. If a filter is already active, choose whether to Replace it or combine it with AND / OR.
- Auto-scroll - keep the list scrolled to the newest telegram, or stop following. Scrolling down by hand pauses it until you return to the top.
- Export Telegrams - see Exporting.
Badge row
The row of badges under the filter bar shows the session's state; each one is tappable.
| Badge | Shows | Tap to |
|---|---|---|
| Start / Stop | Whether the monitor is running, and in which mode | Start, stop, or choose Group or Bus Monitor mode |
| Clear | - | Remove all telegrams from the list; the session keeps running |
| Telegrams | How many telegrams are in the list - or how many match the filter, e.g. 2 / 17 | Open Clear Filter, Clear All Telegrams, and Statistics |
| View | - | Open the telegram view settings - see below |
| ETS Project | Whether a project is loaded - green or red | See the project, or load one |
| Data Secure | KNX Data Secure sender status: grey (none in project), amber (not configured), green (configured) | Open the KNX Secure Senders summary - see KNX Data Secure |
| Gateway | The selected gateway and its connection state | See the gateway's details, or clear the selection while stopped |
On the free plan, the list keeps the last 20 telegrams and says so - see Subscription Plans.
Statistics
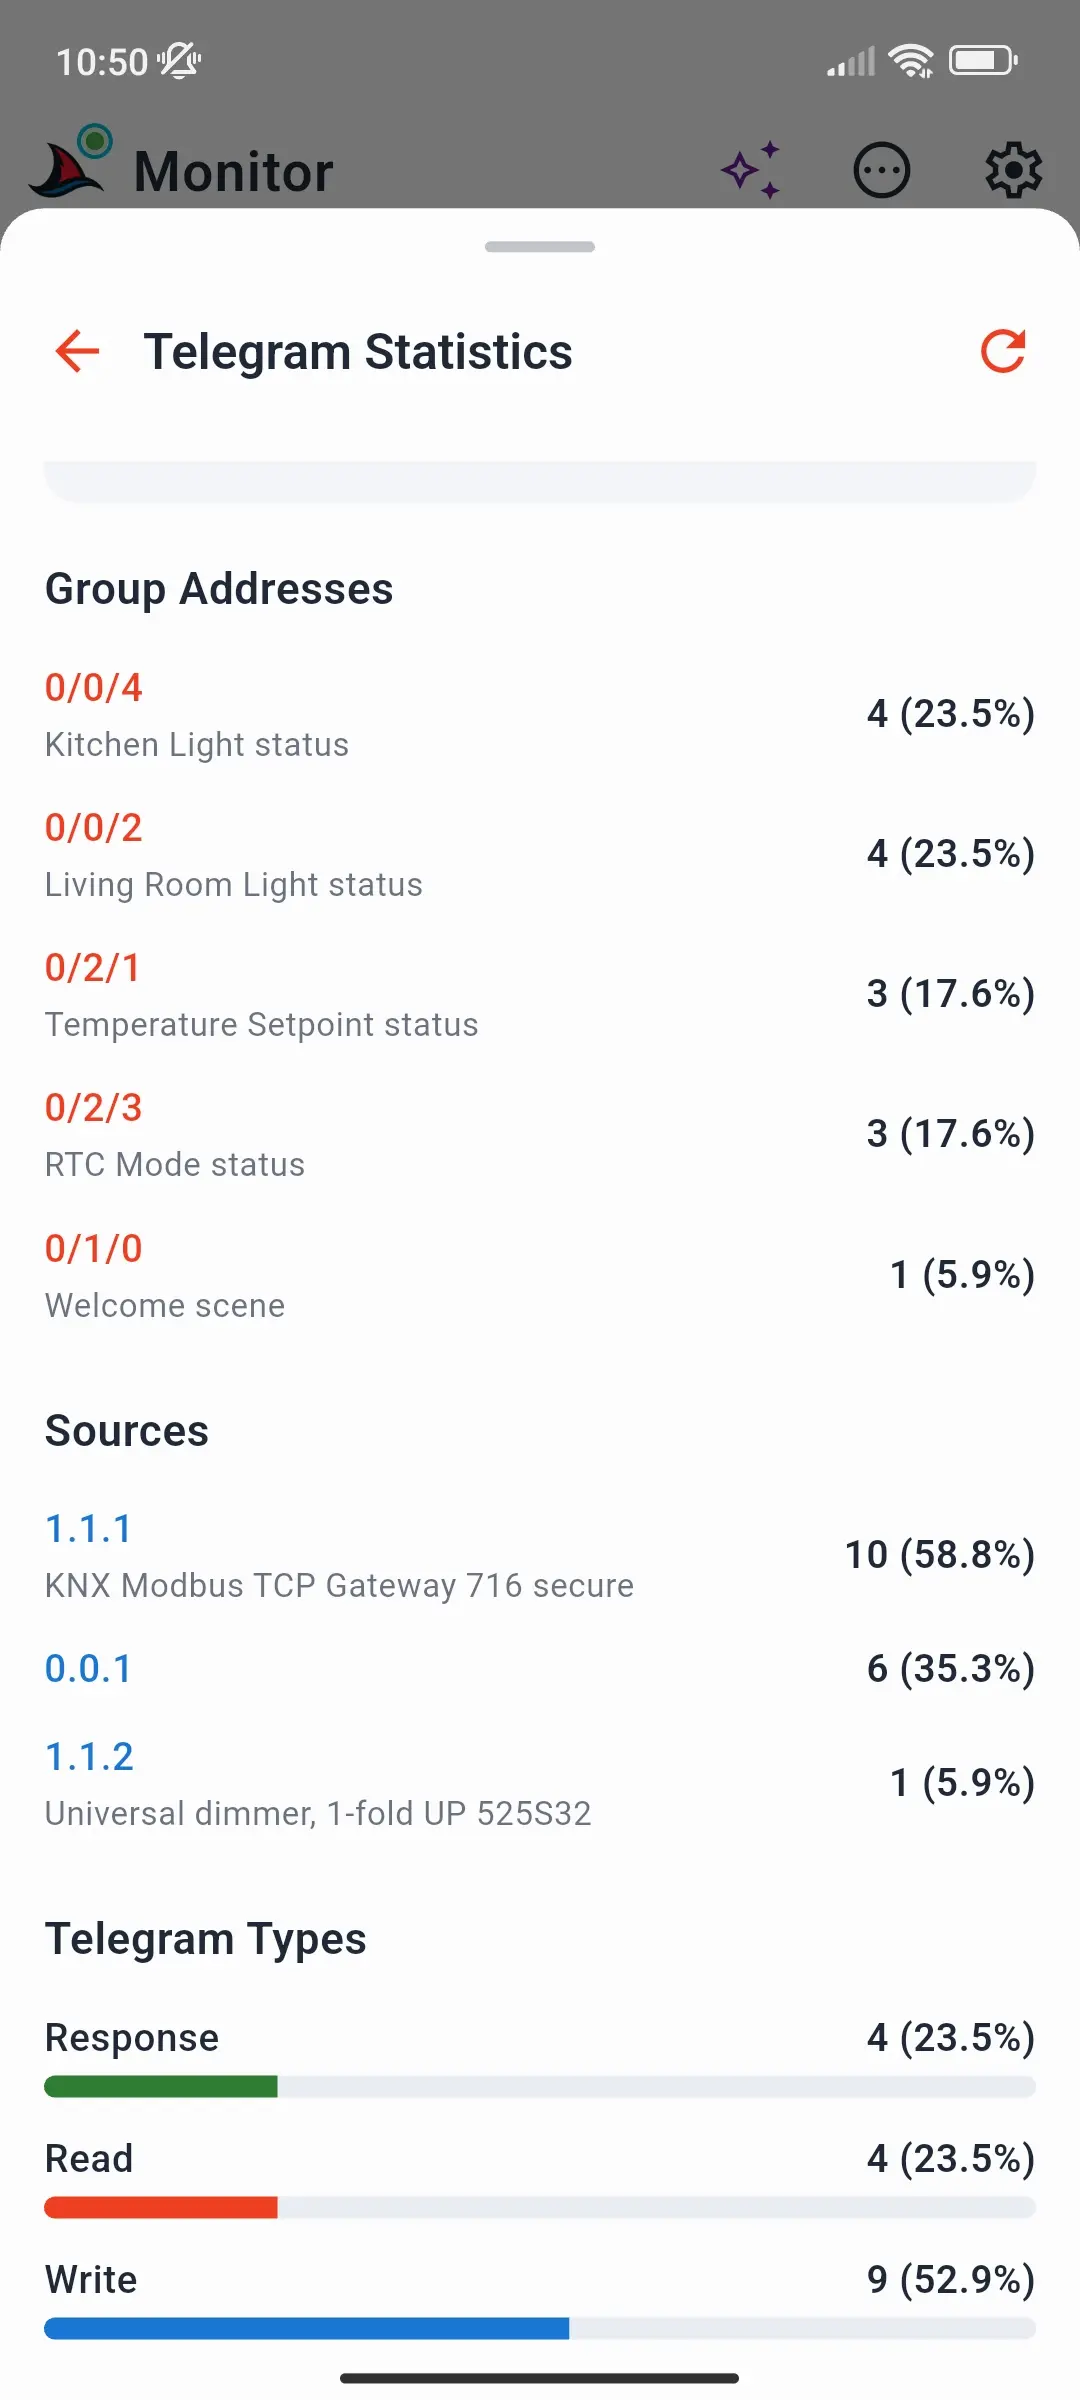
Telegrams → Statistics summarises the list: the total and time period covered, the average rate in telegrams per second, the busiest Group Addresses and Sources with their share of the traffic, and the mix of Telegram Types (write, read, response). Tap refresh to update it while the monitor runs.
View settings
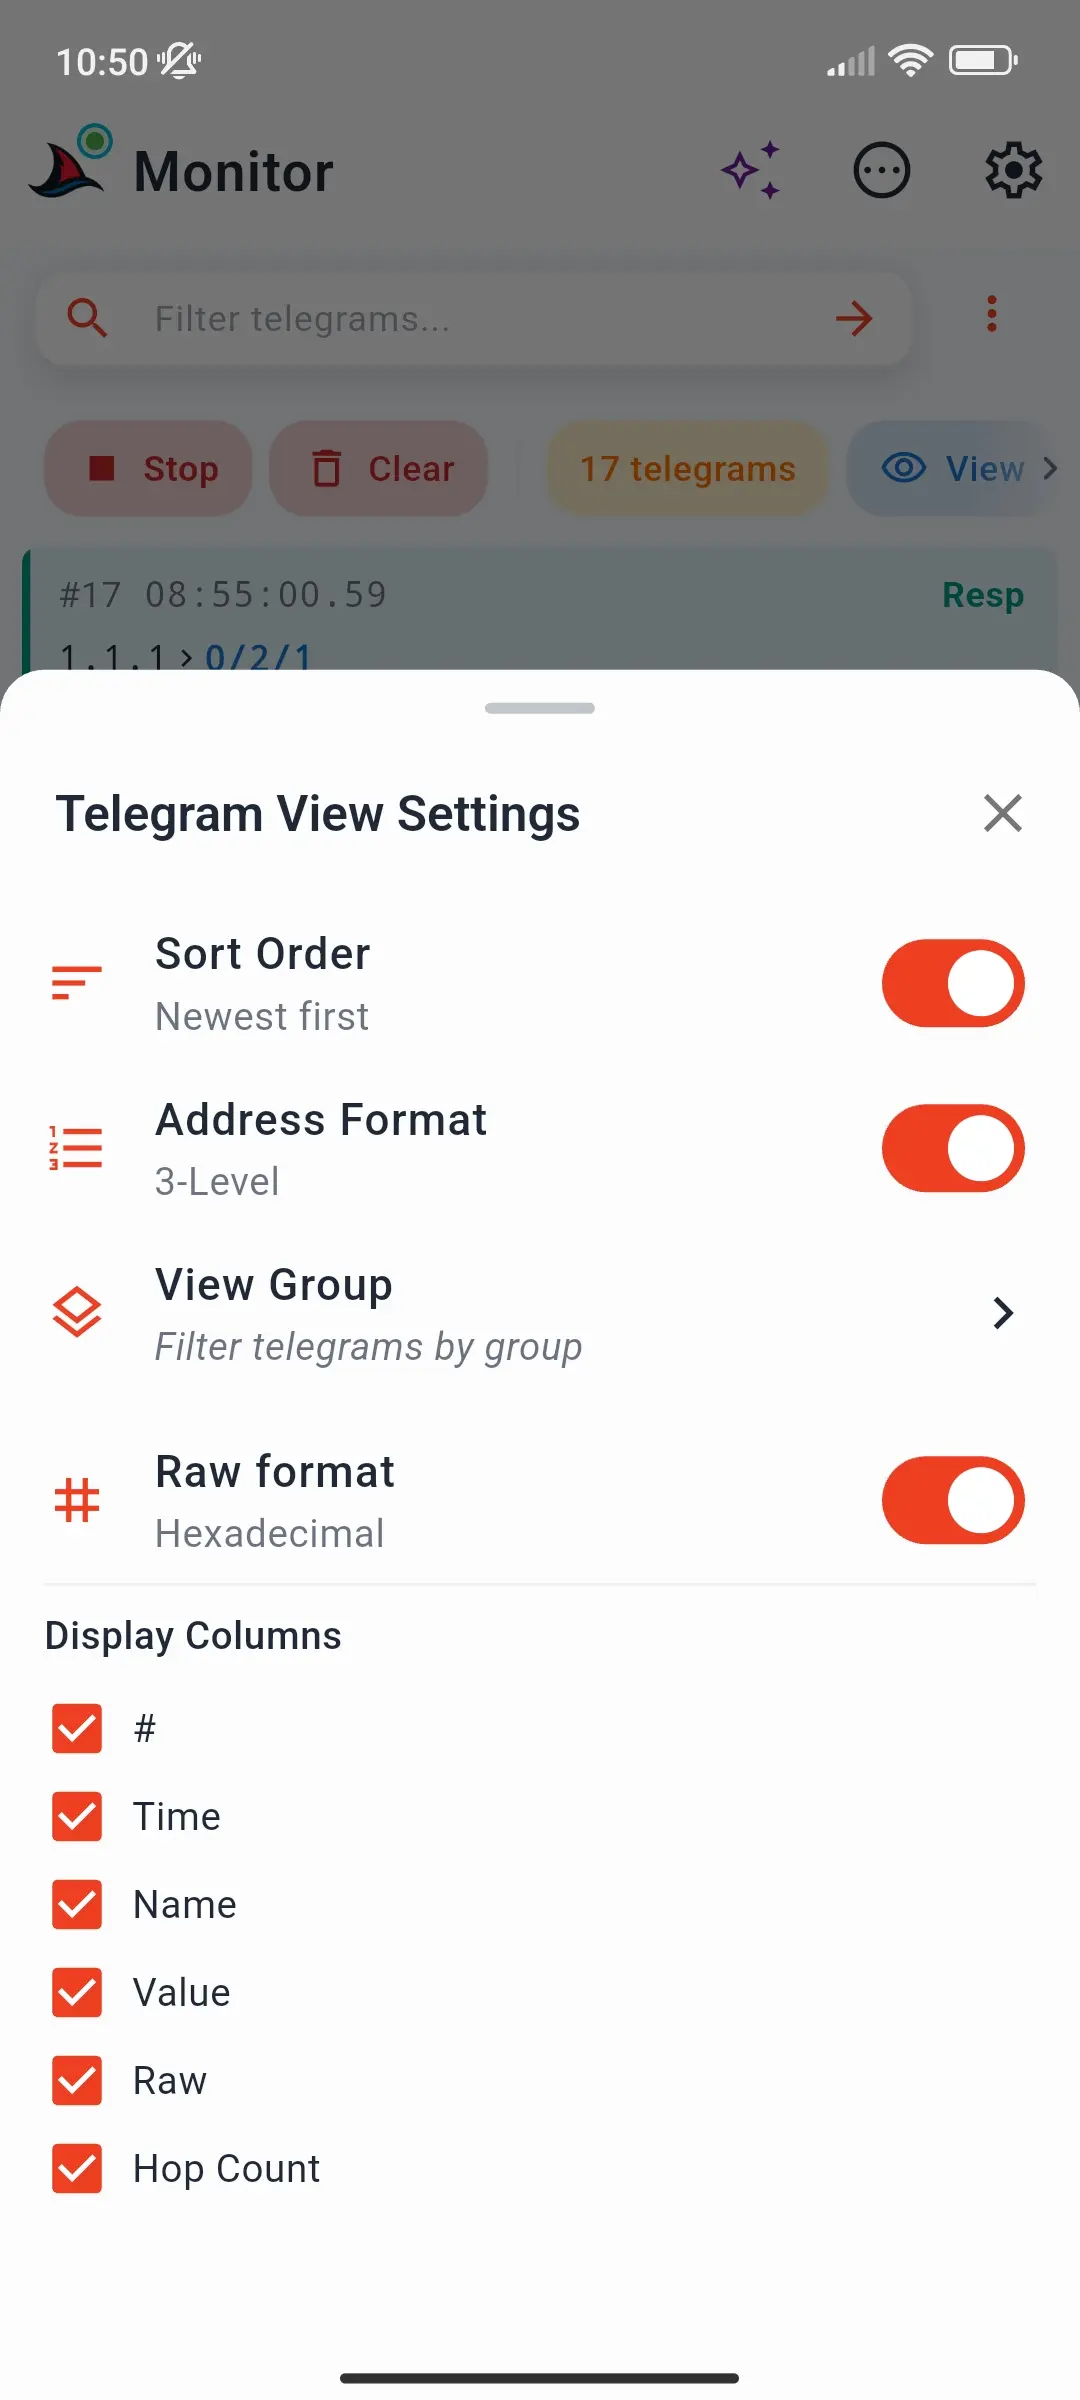
View opens Telegram View Settings:
| Setting | Does |
|---|---|
| Sort Order | Newest first (default) or oldest first |
| Address Format | Show group addresses as 3-level or 2-level |
| View Group | Filter by group address, sender, telegram type, or priority - builds a filter in the filter field |
| Raw format | Show payloads in hexadecimal or decimal |
| Display Columns | Choose what each row shows: #, Time, Name, Value, Raw, Hop Count |
Telegram list
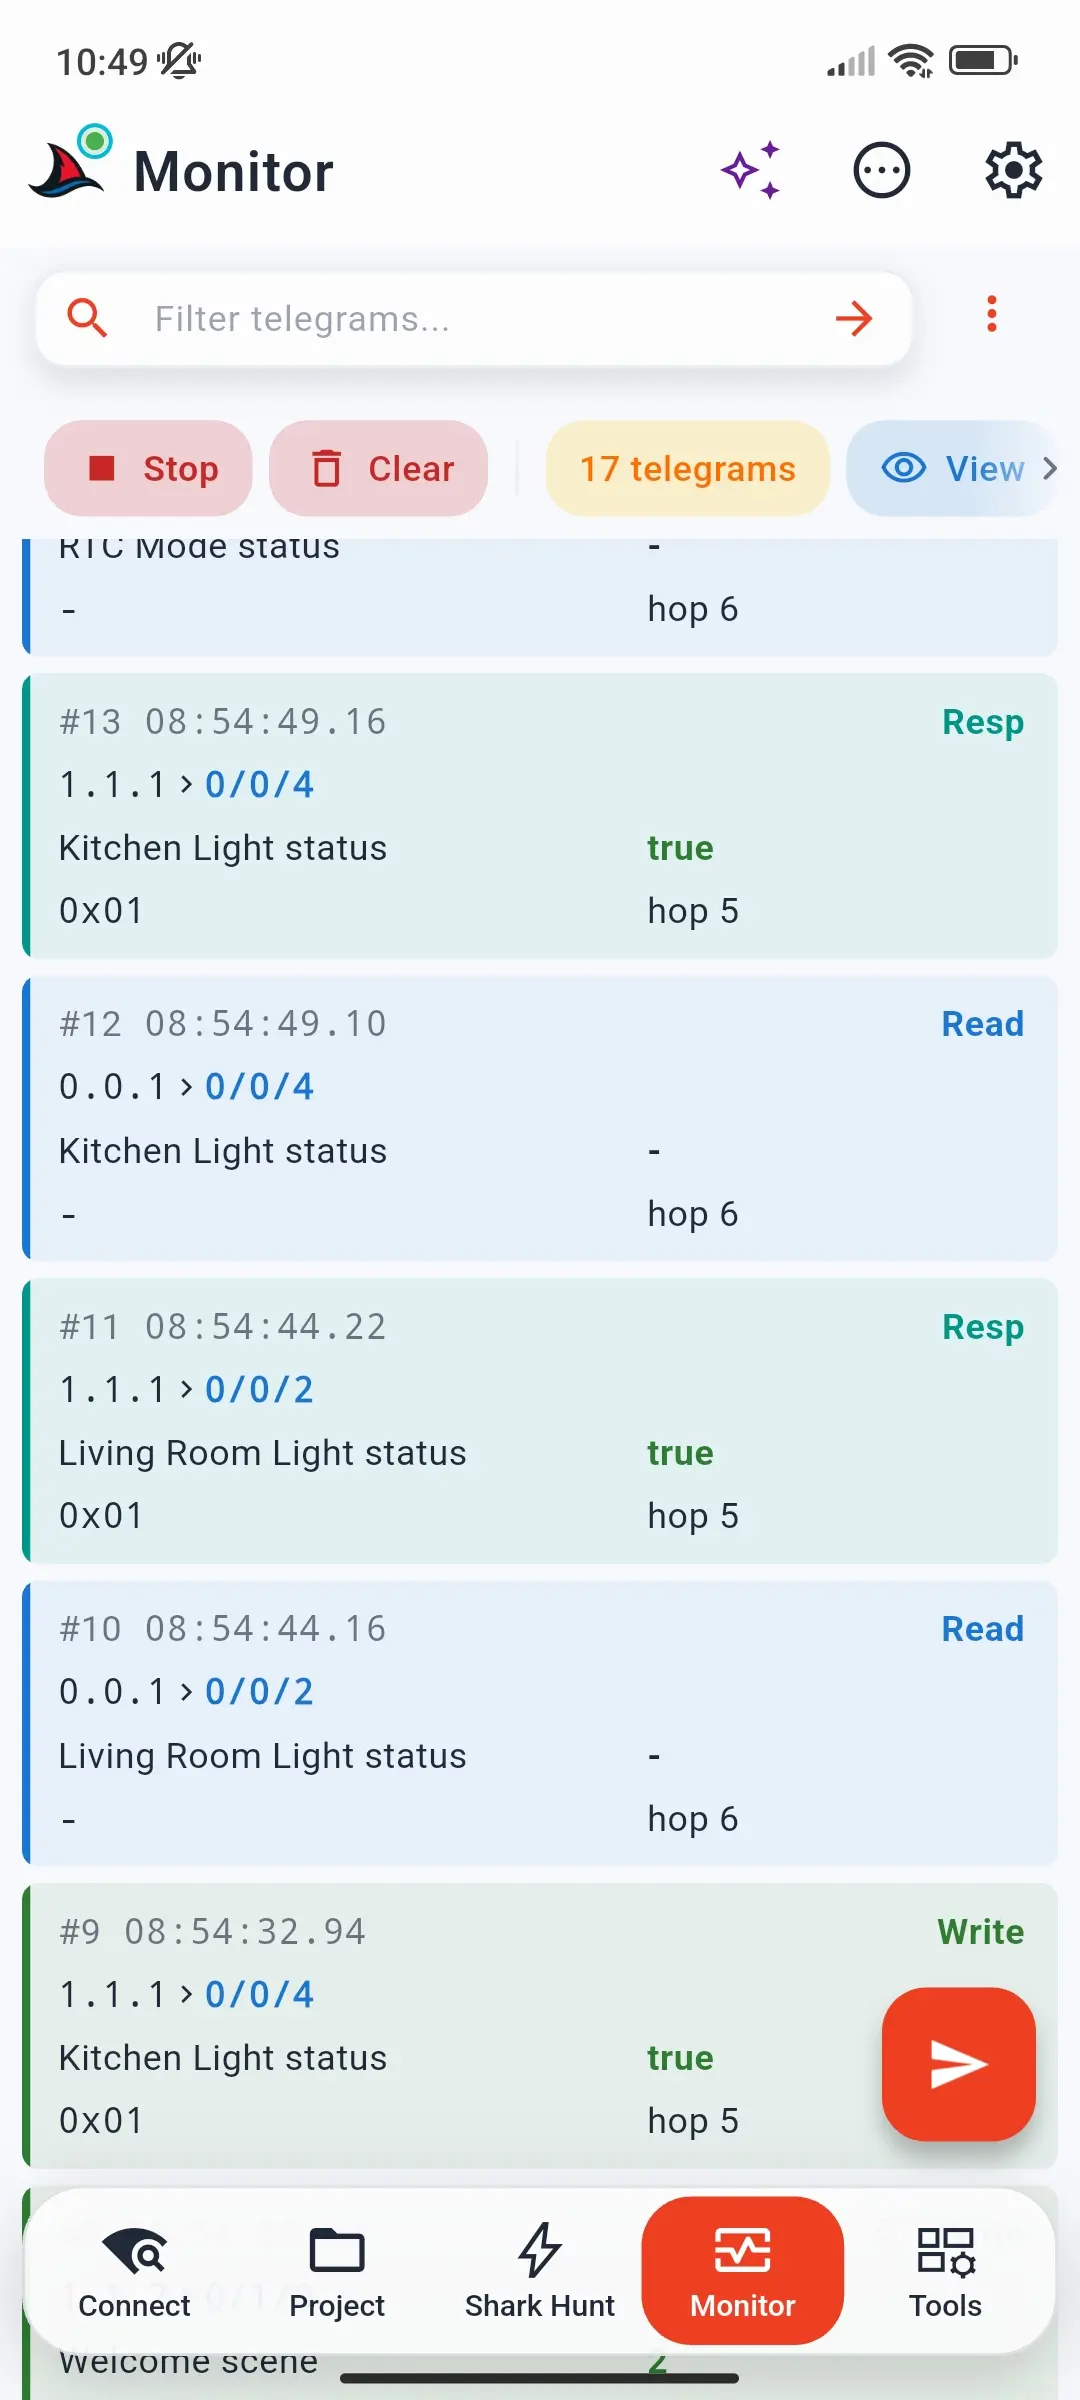
Each row shows the telegram's number and time, its type (Write, Read, or Resp), the sender and destination, the group address name and decoded value, the raw payload, and the hop count. Names and decoded values need a loaded ETS project; the colour of each row follows its type.
Telegram details
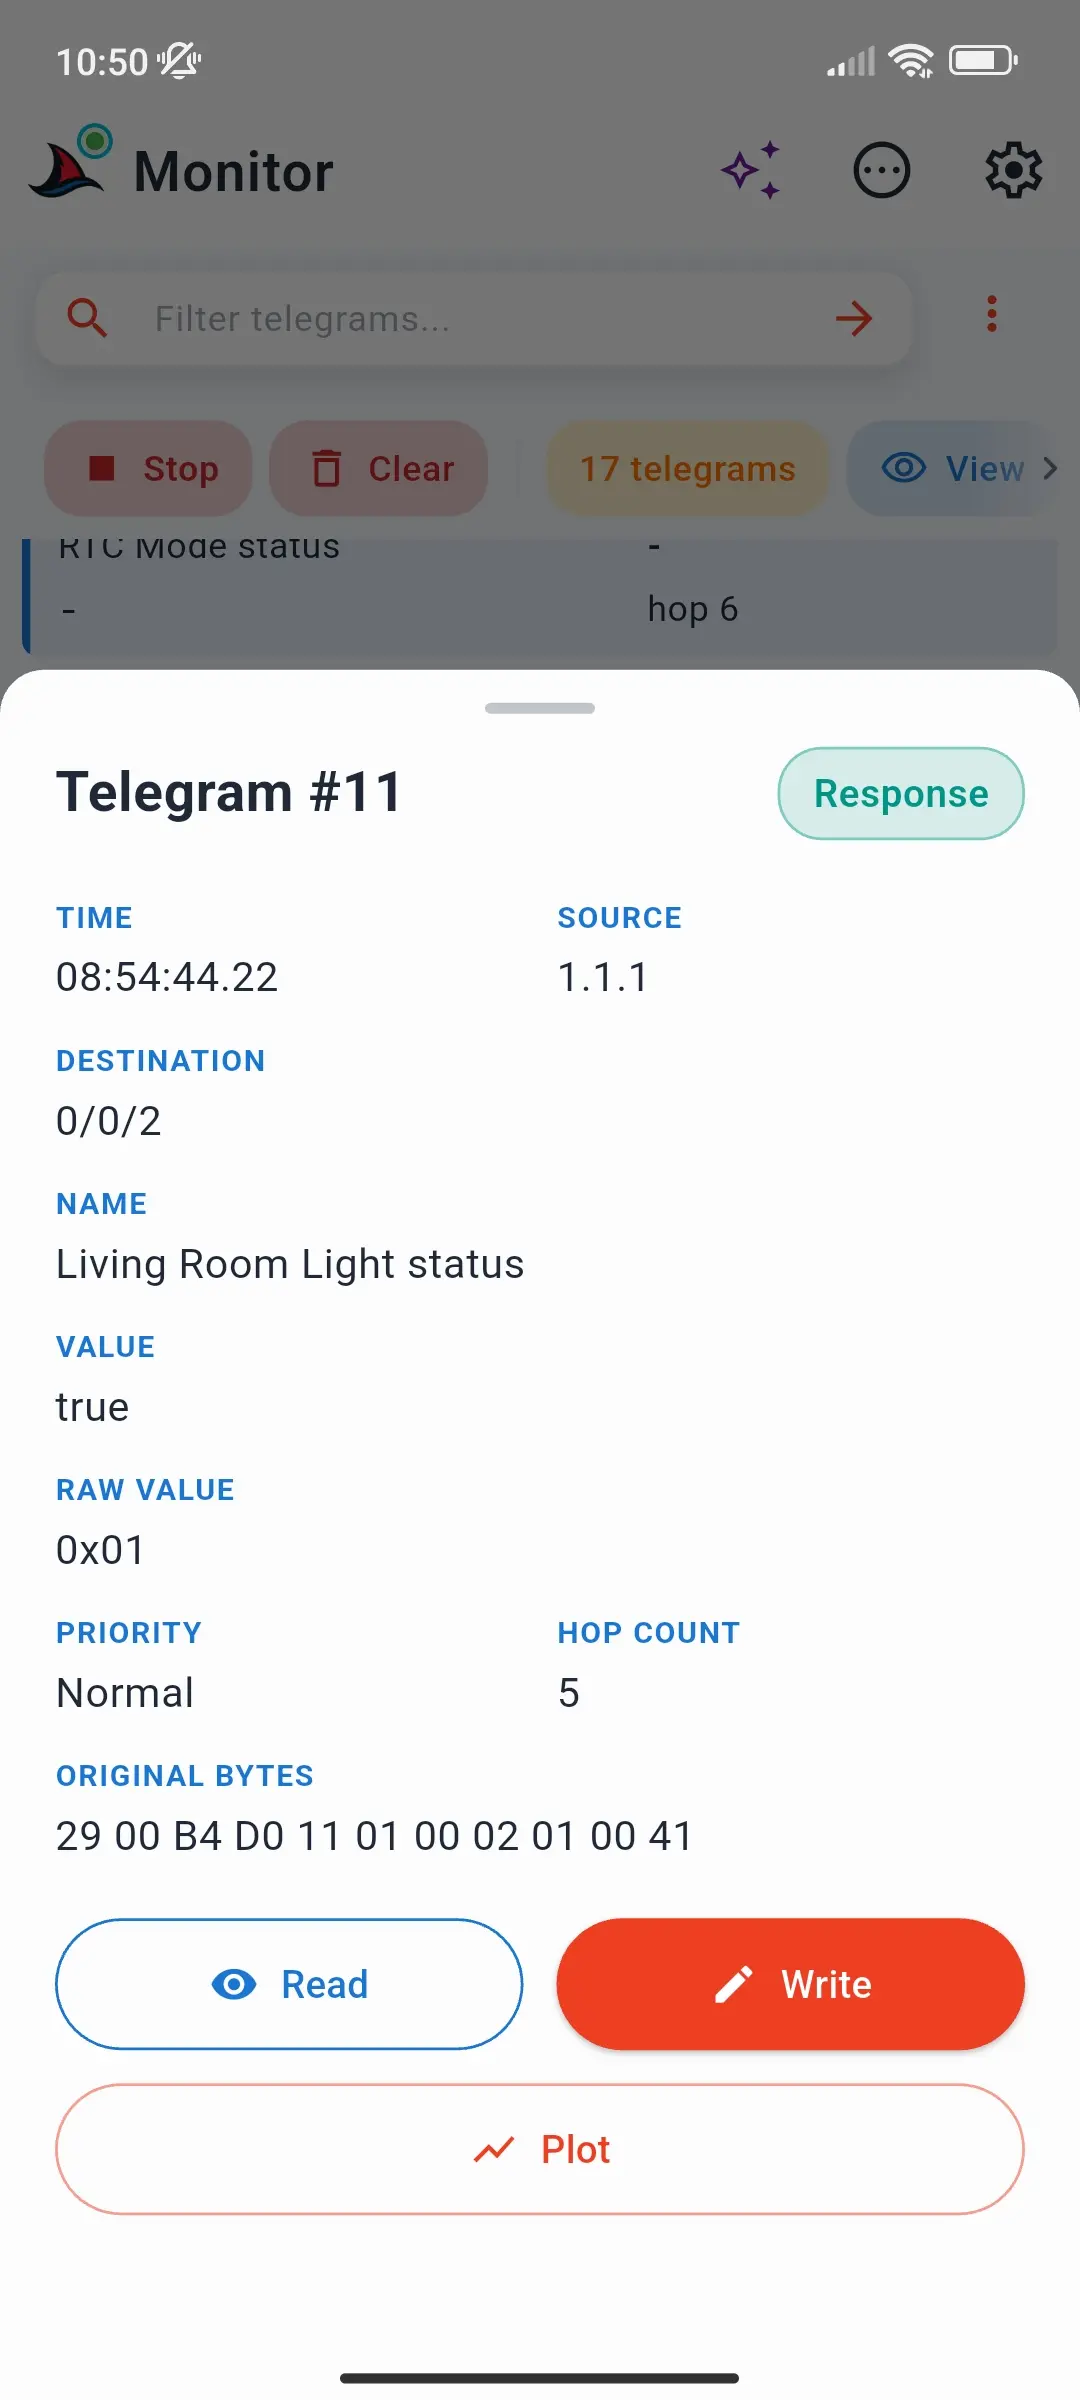
Tap a row to open its details: time, source, destination, name, value, raw value, priority, hop count, and the original bytes of the frame. Three buttons act on it:
- Read - send a read request to the telegram's group address
- Write - open the command composer with the group address and datapoint type filled in
- Plot - chart the group address's values
Plot
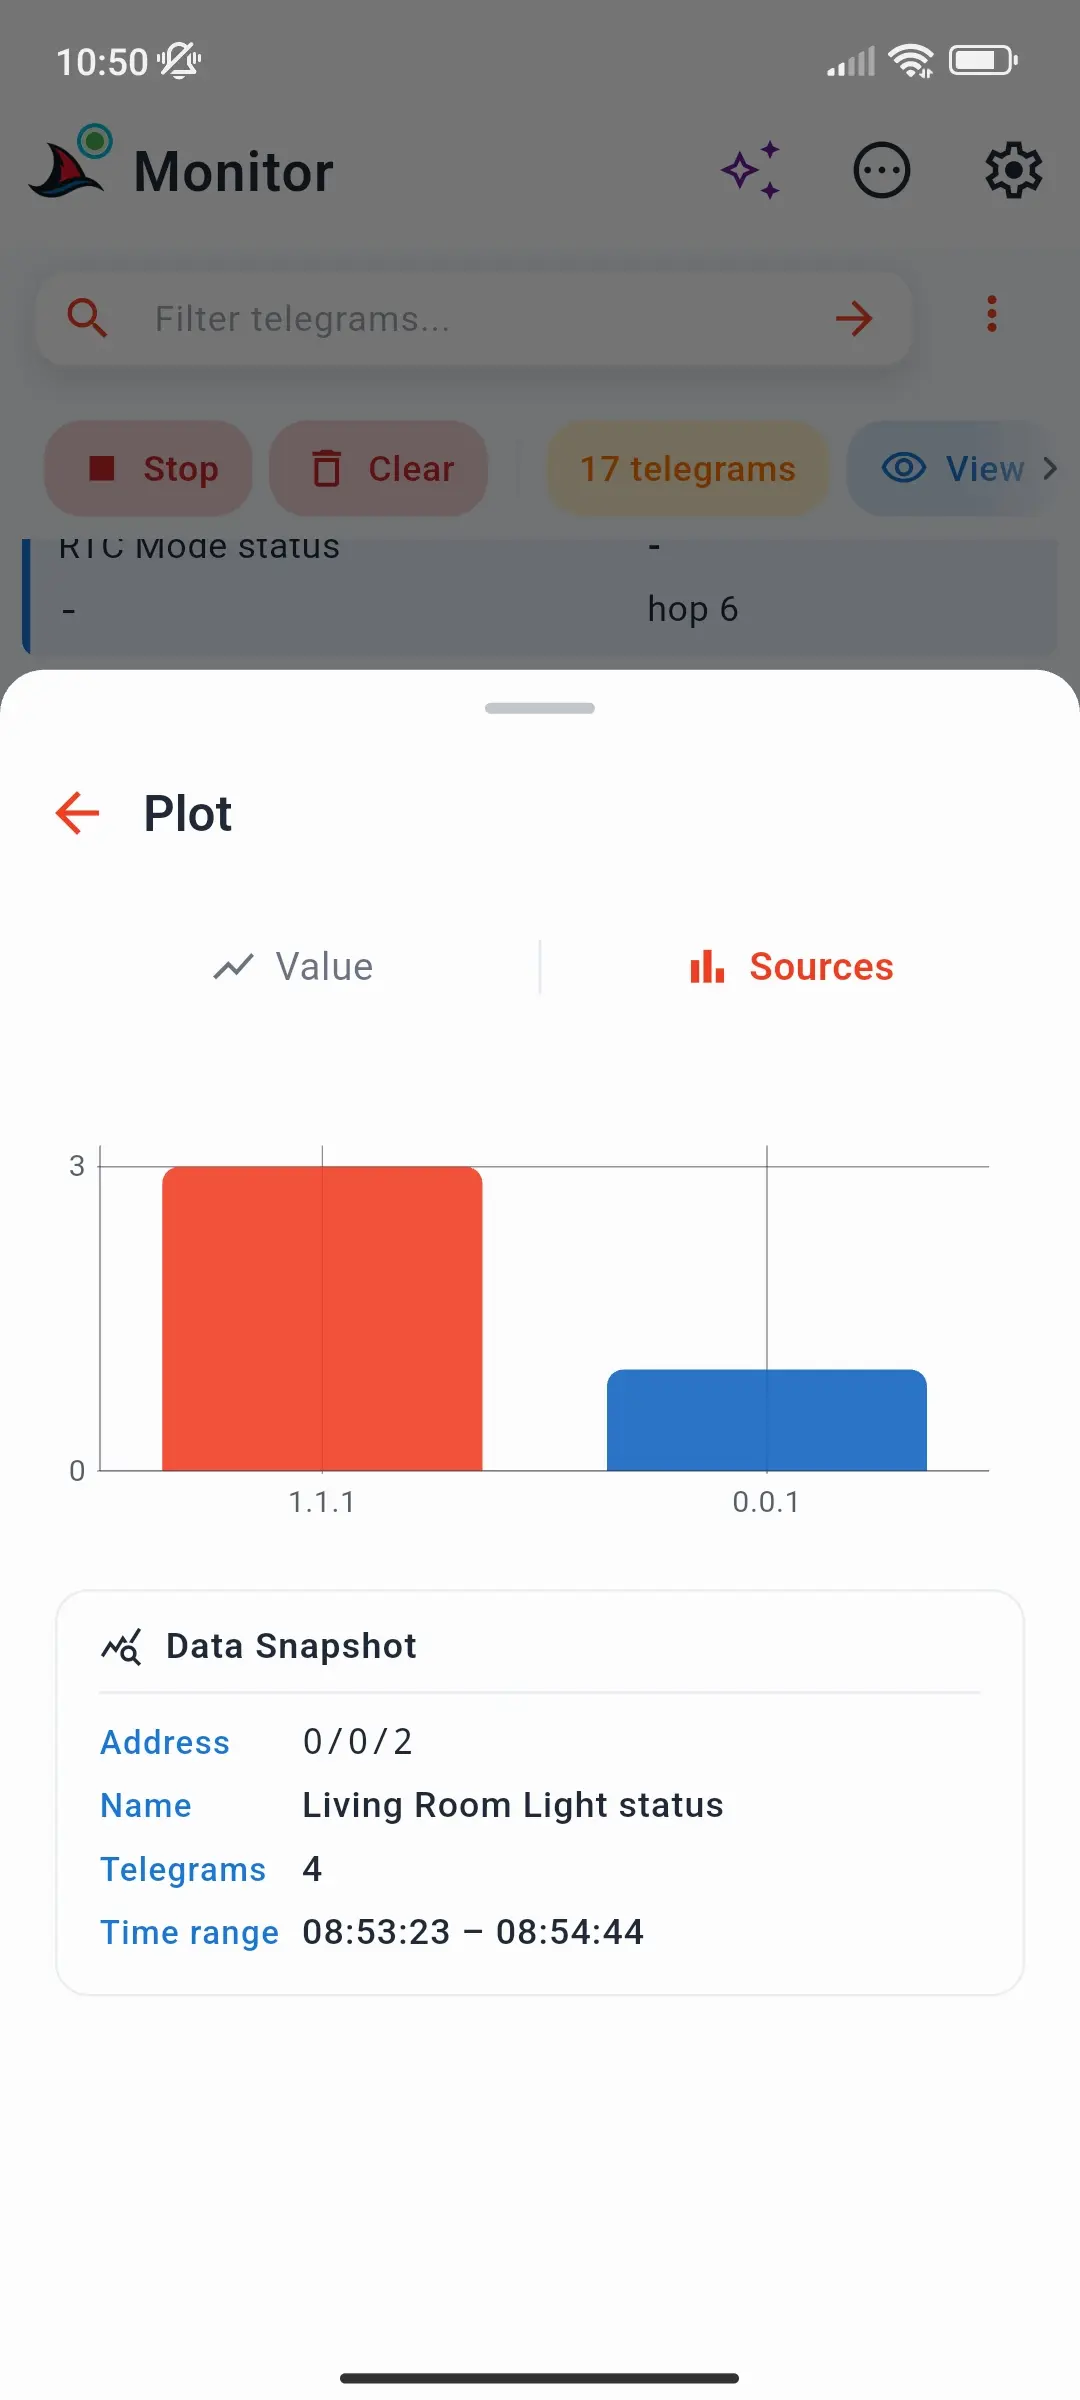
Plot has two tabs:
- Value - the group address's values over time. Pinch to zoom, pan, and tap a point to see its value and time.
- Sources - how many telegrams each sender sent to this group address. An unexpected sender stands out immediately.
A Data Snapshot card shows the address, name, number of telegrams, and the time range the chart covers. The value chart needs a datapoint type from the ETS project.
Sending commands
While the monitor runs, tap the red send button to open Quick Send:
- New Command opens the command composer: group address, write or read, datapoint type, and value.
- Recent lists the commands you sent - tap one to send it again, long-press to edit it first.
Sent commands appear in the list straight away. In Bus Monitor mode the send button is locked, because that mode is receive-only. On the free plan you can send 3 commands a day. See Send Commands for every way to send.
Exporting and importing
Export Telegrams (in the ⋮ menu, or ⋯ Actions) saves or shares the list as an ETS-compatible XML communication log - which opens directly in ETS - or a complete CSV. It exports everything in the buffer, not only what the filter shows.
The ⋯ Actions sheet opens with its Monitor section expanded on this page:
| Action | Does |
|---|---|
| Import SharKNX CSV | Loads a SharKNX CSV export into the list |
| Export Telegrams | Opens the export sheet |
| Import from ETS XML | Loads an ETS communication log, recorded in ETS or exported from SharKNX |
| Apply Project Data | Names and decodes telegrams recorded before the project was loaded - with the monitor stopped |
Importing replaces the telegrams in the list. See Export Telegrams and Export Formats.
Related
- Monitor Filter Syntax - every filter field and operator
- Monitor Settings - keep screen on and buffer size
- Export Telegrams - XML and CSV exports