The Shark Hunt page is where you keep and run your shark hunts - reusable sets of KNX send actions and monitor filters, saved as portable files you can share. Each hunt opens its own page with one-tap actions, ready-made monitor filters, and optionally its own gateway. It is the third tab in the bottom navigation bar.
For what a hunt is and how its actions work, see Shark Hunts. Shark Hunts are a premium feature on Android, iOS, and macOS - see Subscription Plans.
Your hunts
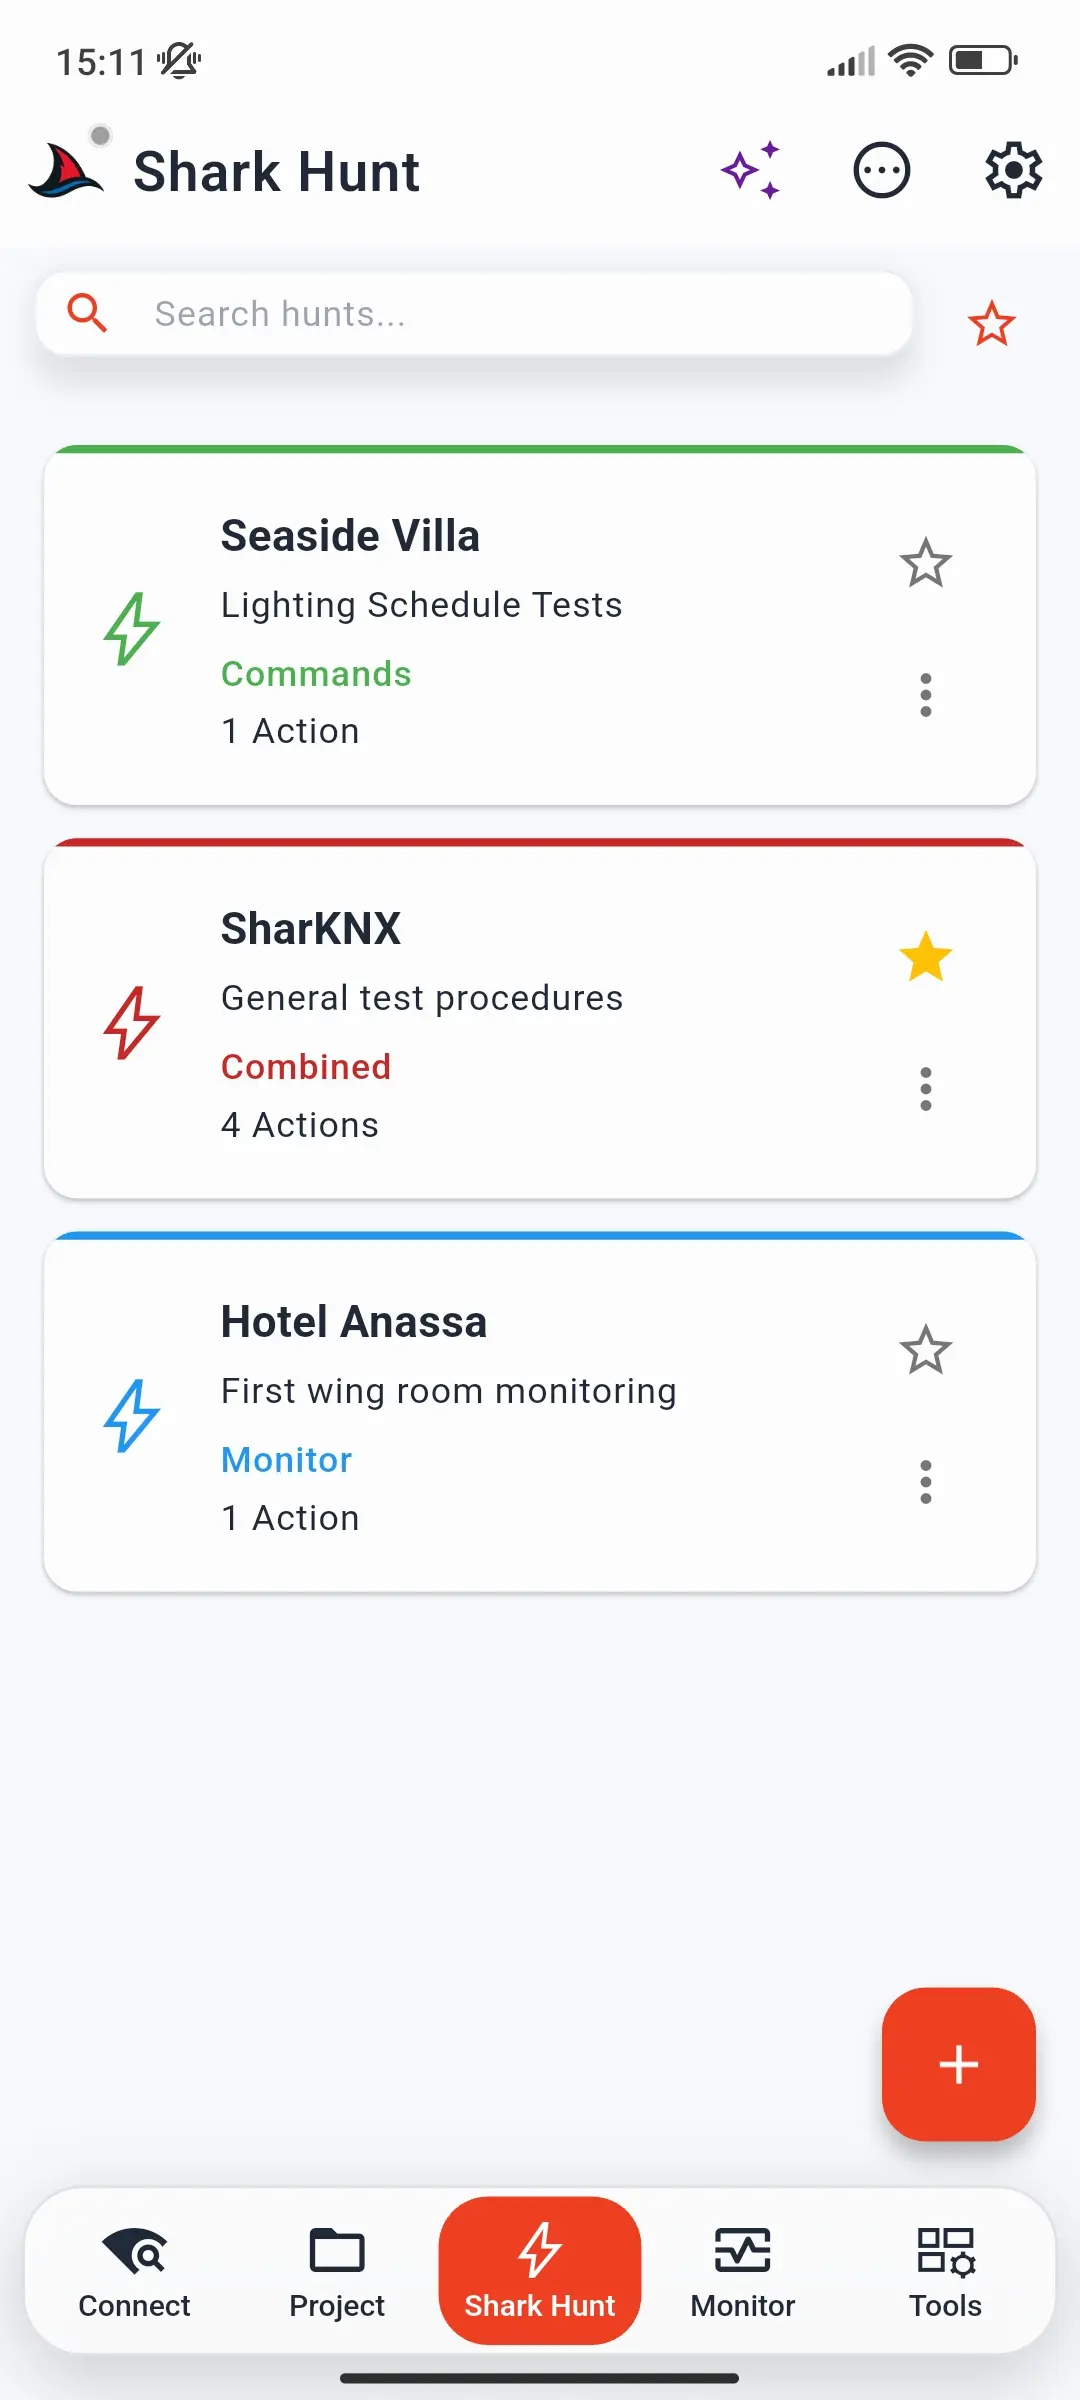
The page lists every hunt you have saved as a card. The Search hunts field filters the cards by name, and the star next to it shows only your favourites.
Each card shows the hunt's name, description, type, and number of actions. The colour of the top border and the type label show what the hunt contains:
| Colour | Type | Contains |
|---|---|---|
| Green | Commands | Send actions only |
| Blue | Monitor | Monitor actions only |
| Red | Combined | Send and monitor actions |
| Grey | - | An unfinished hunt, saved during creation. Tapping it asks you to edit it and finish setup. |
On each card:
- The star marks the hunt as a favourite.
- The ⋮ menu offers Edit, Export (saves the hunt as a file), Share, Delete, and Info - the hunt's details, gateway, and when it was created, last modified, and last run.
Long-press a card to select several hunts, then Duplicate, Export Selected, or Delete them together.
Tap the + button to create a hunt - see Create a Shark Hunt. You can keep up to 25 hunts - see Limits.
Actions for this page
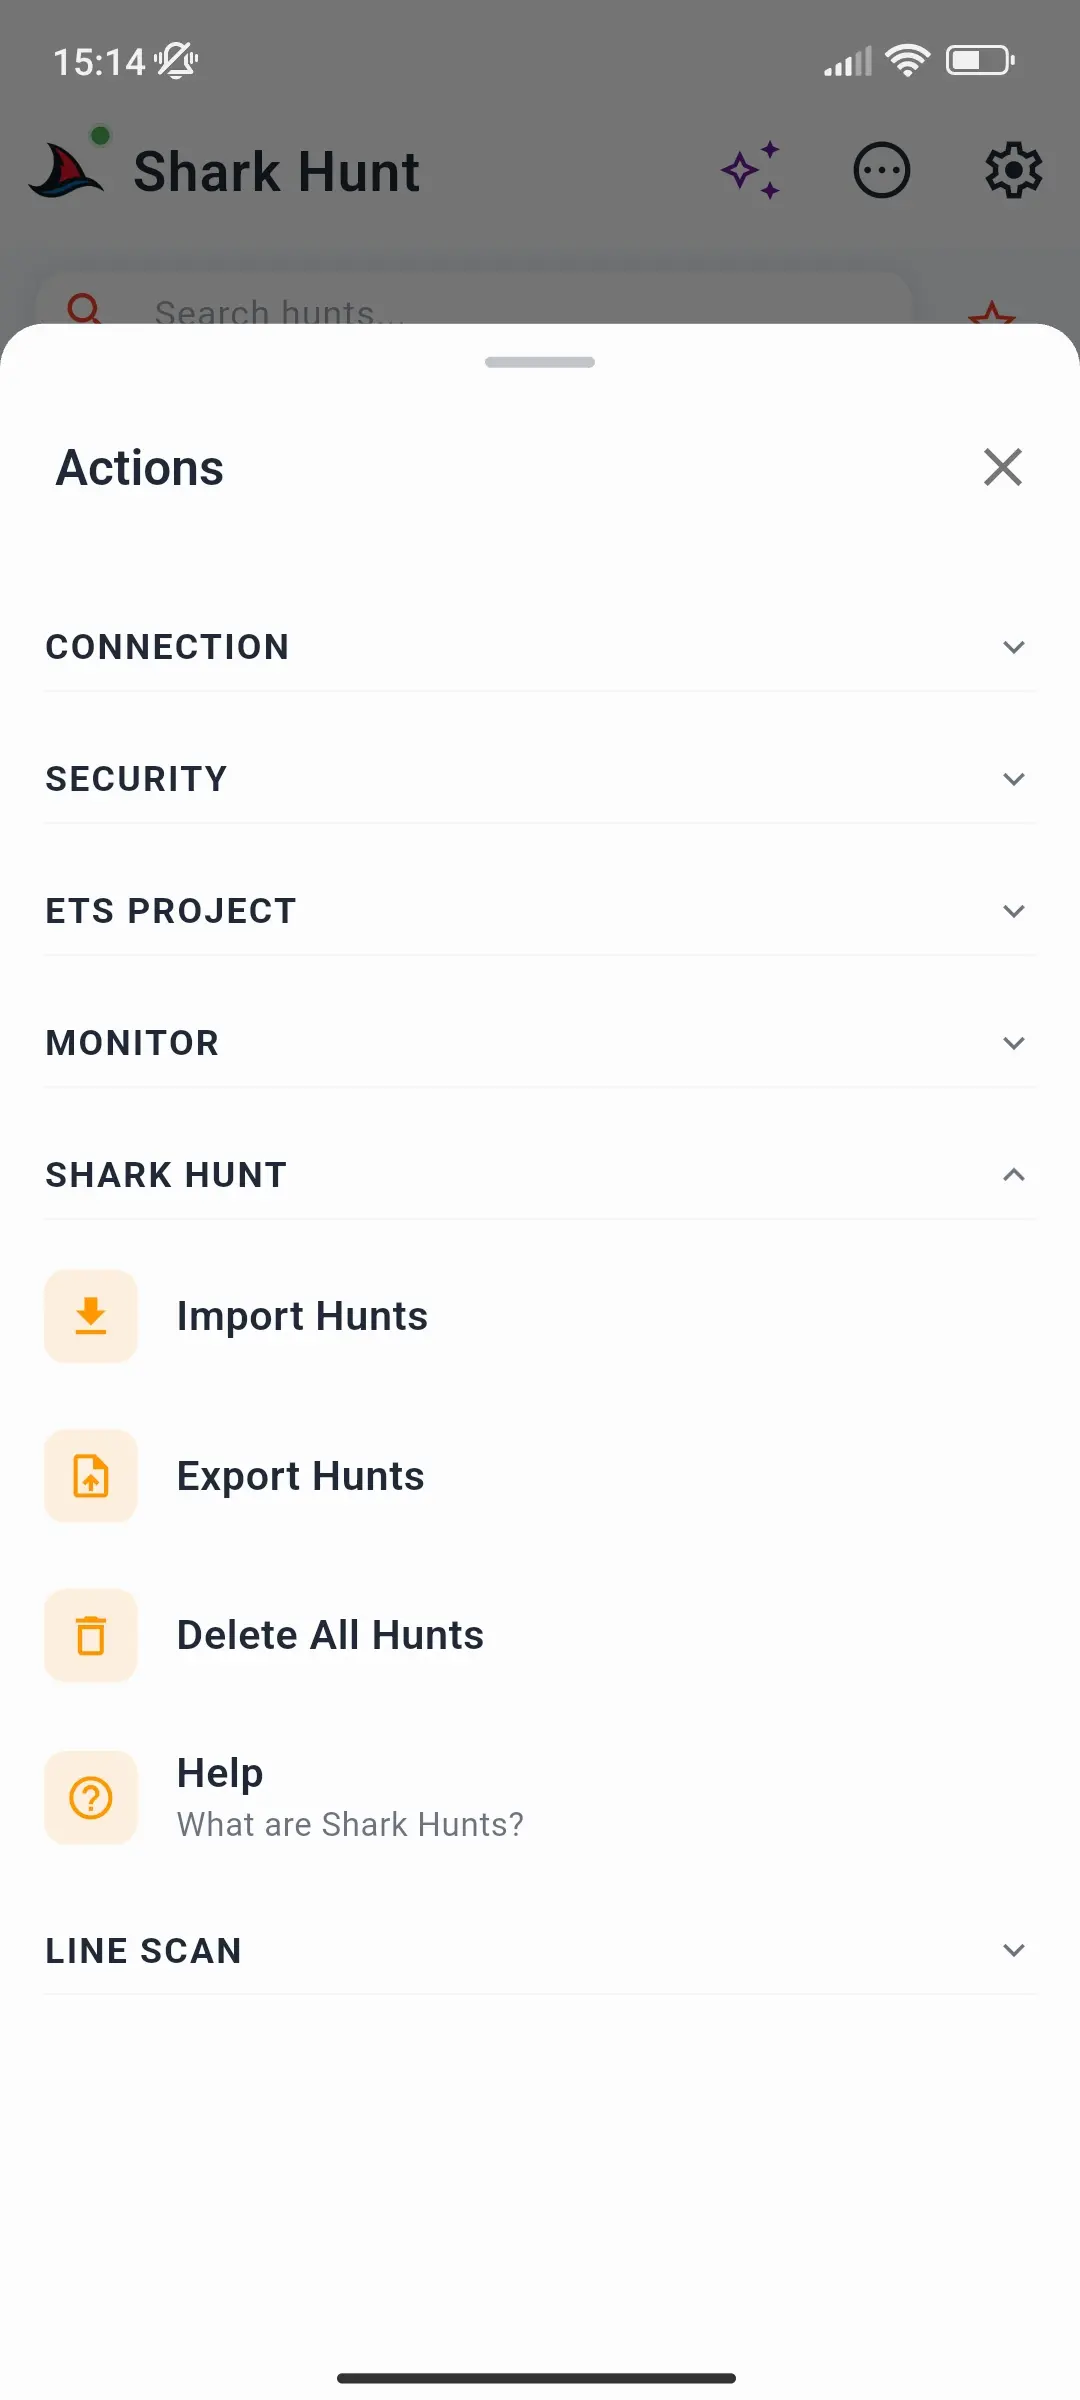
On this page the ⋯ Actions sheet opens with its Shark Hunt section expanded:
| Action | Does |
|---|---|
| Import Hunts | Loads hunts from a file - one hunt or a whole collection |
| Export Hunts | Saves all your hunts in one file |
| Delete All Hunts | Removes every hunt, after asking you to confirm |
| Help | An in-app guide to Shark Hunts, action types, and examples |
See Sharing and Portability and Side Menu and Actions.
Hunt page
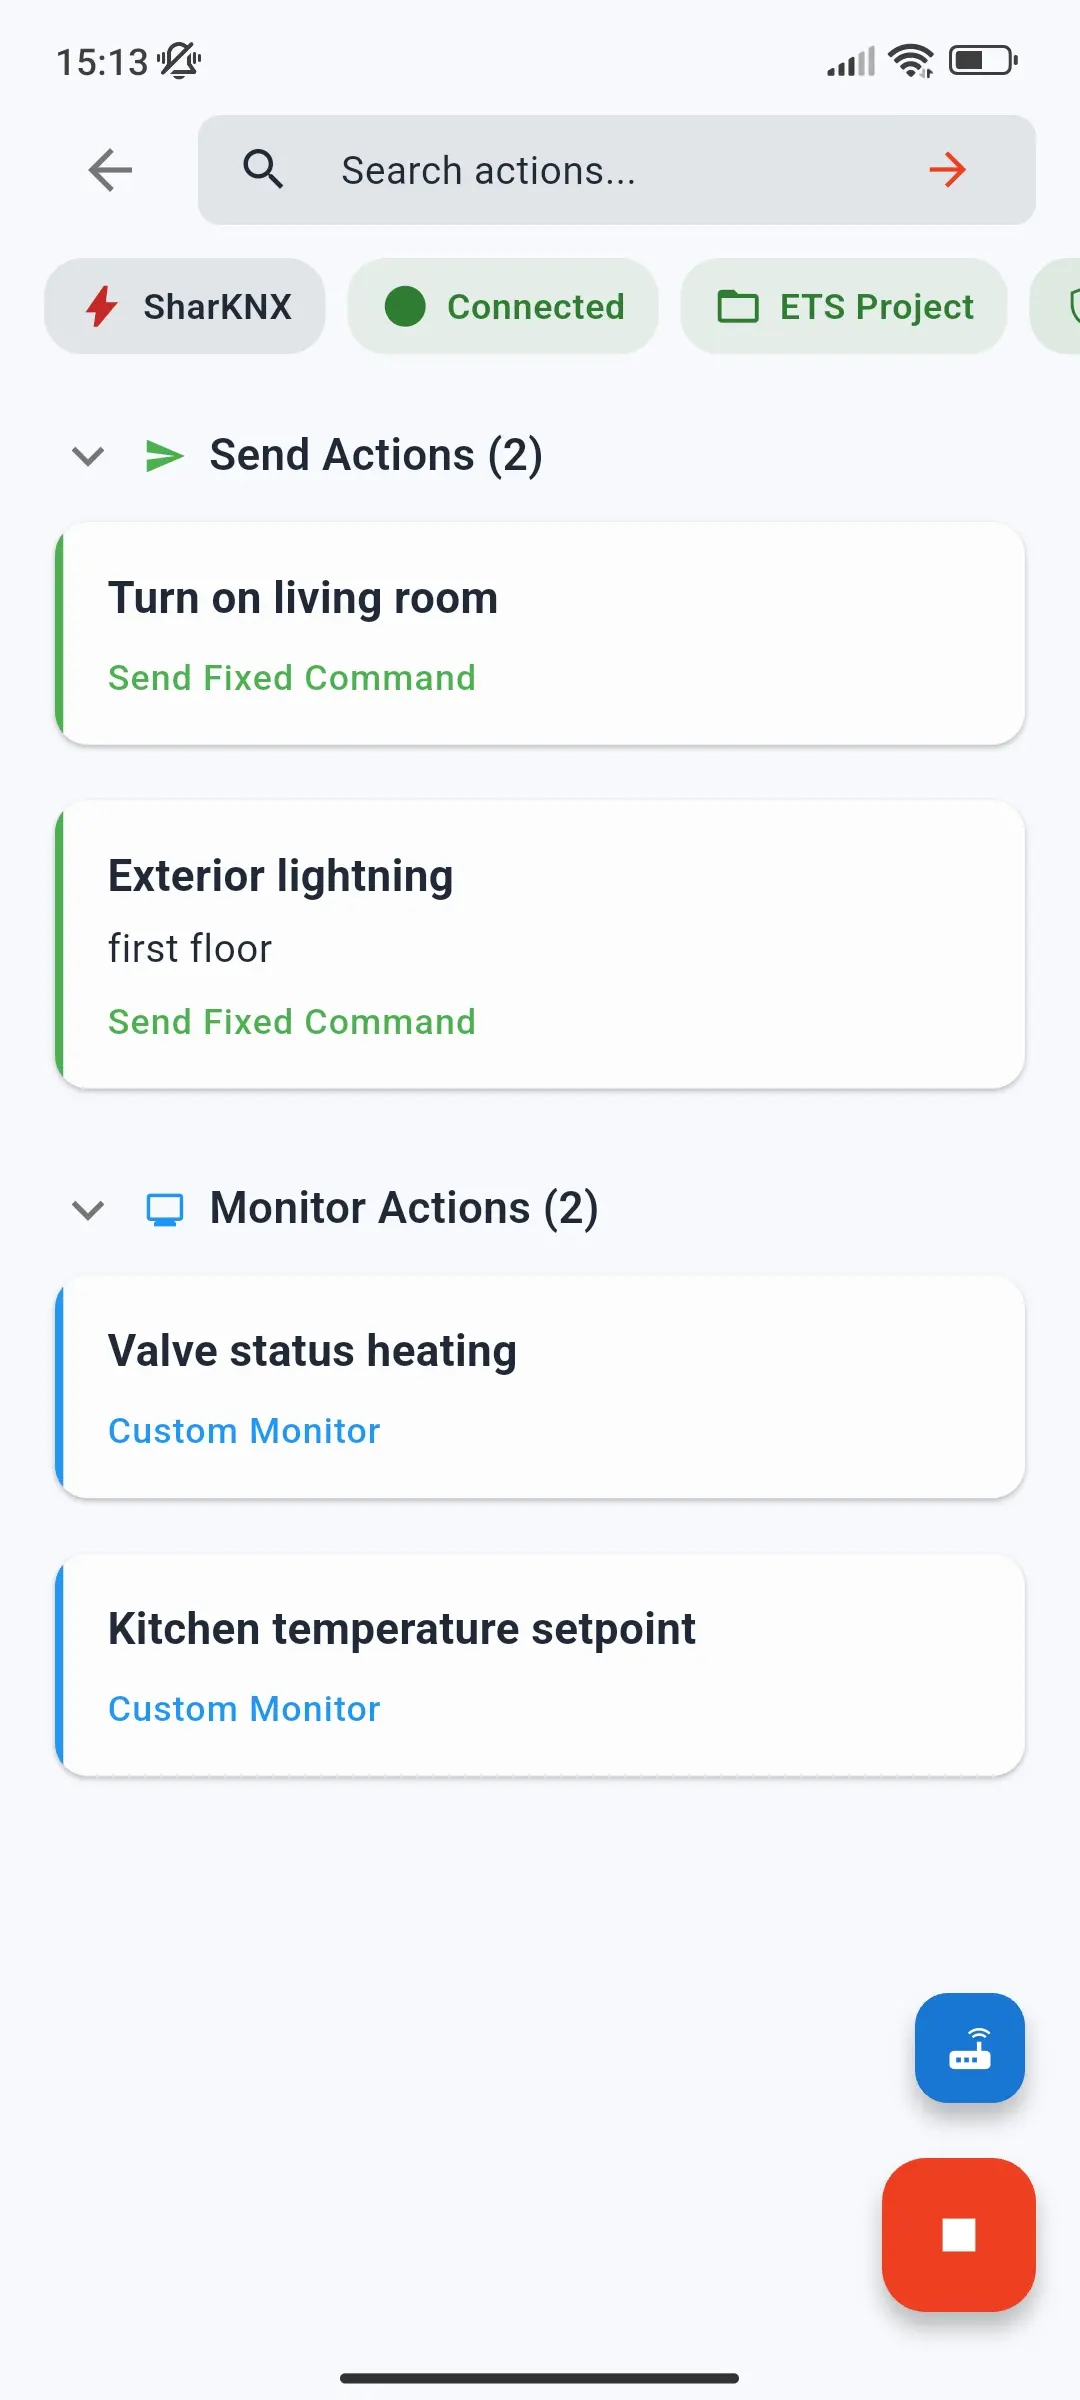
Tap a hunt to open its page. The top bar has a back button and a Search actions field that filters the action cards.
Badges
| Badge | Shows | Tap to |
|---|---|---|
| Hunt name | - | Open the hunt's details |
| Connection | Connected (green) or Disconnected (red) | Connect or disconnect |
| ETS Project | Whether a project is loaded | See the project, or load or unload one |
| Data Secure | KNX Data Secure sender status: grey (none in project), amber (not configured), green (configured) | Open the KNX Secure Senders summary - see KNX Data Secure |
| Gateway | The selected gateway | See the gateway's details |
Connecting
The action cards stay faded until you connect.
- The small blue gateway button opens Select Gateway: the Hunt's Gateway saved with the hunt, Configured Gateways, Discovered Gateways, and multicast routing. Go to Connection Page takes you to the Connect page to find more.
- The large button connects - it is green while disconnected. Once connected it turns red; tap it to disconnect.
Send actions
Send Actions are listed first, with how many there are; tap the heading to collapse the section. Tap a card to run it:
- Send Fixed Command sends its value straight away.
- Send Multiple/Sequence sends its commands in order, with any delays you set. Tap the card again while it runs to cancel.
- Send Variable opens a sheet with an input for the datapoint type - for example a slider for a percentage - and sends what you choose.
A card turns green when its commands are sent, or red if sending fails. See Send Actions for each type.
Monitor actions
Monitor Actions follow below. Tap one to open the Shark Hunt Monitor with its filter.
Shark Hunt Monitor
The Shark Hunt Monitor is a bus monitor that shows only the telegrams matching the monitor action's filter. The top bar shows the hunt and action name, and an export button.
Tap the large start button to begin monitoring and tap it again to stop. If the main Monitor is already running, SharKNX asks to stop it first. The small button above it switches to another monitor action of the hunt - the active one has a green dot. Switching clears the captured telegrams, so SharKNX asks first.
Badges
| Badge | Tap to |
|---|---|
| Send | Open Quick Send - a new command, or one of your recent commands |
| Filter details | See the conditions of the active filter |
| Clear all | Remove the captured telegrams |
| Data Secure | Open the KNX Secure Senders summary |
| View | Change the sort order and address format |
| Telegrams | Open statistics - shows how many telegrams are captured, up to 3000 |
| Gateway | See the gateway's details |
Telegrams
The list works like the Monitor page's: tap a telegram for its details, with Read, Write, and Plot - see Telegram details.
The export button saves or shares the captured telegrams as an ETS-compatible XML log or a CSV file - see Export Formats.
Captured telegrams are not kept. When you leave the Shark Hunt Monitor, SharKNX warns you that they will be lost - export them first if you need them.
Related
- Shark Hunts - hunts, actions, and filters explained
- Create a Shark Hunt - the creation wizard
- Monitor Page - the main bus monitor